QUARTERLY REPORT PURSUANT TO SECTION 13 OR 15(d) OF THE SECURITIES EXCHANGE ACT OF 1934 |
TRANSITION REPORT PURSUANT TO SECTION 13 OR 15(d) OF THE SECURITIES EXCHANGE ACT OF 1934 |

(State or other jurisdiction of incorporation or organization) | (I.R.S. Employer Identification No.) | ||
(Address of principal executive offices) | (Zip Code) | ||
Title of each class | Trading Symbol(s) | Name of each exchange on which registered | ||
Non-accelerated filer | Accelerated filer | Smaller reporting company | Emerging growth company | |
☒ | ☐ | ☐ |
![]() |
Item Number | Item | Page |
GLOSSARY | ||
PART I | FINANCIAL INFORMATION | |
Item 1. | ||
Item 2. | ||
Item 3. | ||
Item 4. | ||
PART II | OTHER INFORMATION | |
Item 1. | Legal Proceedings | |
Item 1A. | ||
Item 2. | ||
Item 5. | Other Information | |
Item 6. | ||
SIGNATURE |
![]() | GLOSSARY | 1 |
Terms | Definitions | |
AFS | Available-for-sale | |
ASC | Accounting Standards Codification | |
ASU | Accounting standards update | |
Board | Board of directors | |
BNS | The Bank of Nova Scotia | |
BPS | Basis points | |
CAD | Canadian Dollar ($) | |
CORRA | Canadian Overnight Repo Rate Average | |
CPO | Certified pre-owned | |
DFC | Driveway Finance Corporation | |
EBITDA | Earnings before interest, taxes, depreciation, and amortization | |
EPS | Earnings per share | |
FASB | Financial Accounting Standards Board | |
GAAP | Generally accepted accounting principles | |
LAD | Lithia and Driveway | |
LMMH | Lithia Marubeni Mobility Holdings | |
Mizuho | Mizuho Bank, Ltd. | |
NCI | Non-controlling interest | |
NM | Not meaningful | |
NYSE | New York Stock Exchange | |
PINE.L | Pinewood Technologies Group PLC | |
PPA | Purchase price allocation | |
RSU | Restricted stock units | |
SEC | Securities and Exchange Commission | |
SG&A | Selling, general, and administrative | |
SOFR | Secured Overnight Financing Rate | |
U.K. | United Kingdom | |
U.S. | United States of America | |
USB | US Bank National Association | |
YTD | Year-to-date |
![]() | CONSOLIDATED FINANCIAL STATEMENTS | 2 |
CONSOLIDATED BALANCE SHEETS | |||
(In millions; Unaudited) | September 30, 2026 | December 31, 2025 | |
Assets | |||
Current assets: | |||
Cash, restricted cash, and cash equivalents | $ | $ | |
Accounts receivable, net of allowance for doubtful accounts of $ | |||
Inventories, net | |||
Other current assets | |||
Total current assets | |||
Property and equipment, net of accumulated depreciation of $ | |||
Operating lease right-of-use assets | |||
Finance receivables, net of allowance for credit losses of $ | |||
Goodwill | |||
Franchise value | |||
Other non-current assets | |||
Total assets | $ | $ | |
Liabilities and equity | |||
Current liabilities: | |||
Floor plan notes payable | $ | $ | |
Floor plan notes payable: non-trade | |||
Current maturities of long-term debt | |||
Current maturities of non-recourse notes payable | |||
Trade payables | |||
Accrued liabilities | |||
Total current liabilities | |||
Long-term debt, less current maturities | |||
Non-recourse notes payable, less current maturities | |||
Deferred revenue | |||
Deferred income taxes | |||
Non-current operating lease liabilities | |||
Other long-term liabilities | |||
Total liabilities | |||
Equity: | |||
Preferred stock - no par value; authorized | |||
Common stock - no par value; authorized | |||
Additional paid-in capital | |||
Accumulated other comprehensive income | |||
Retained earnings | |||
Total stockholders’ equity - Lithia Motors, Inc. | |||
Non-controlling interest | |||
Total equity | |||
Total liabilities and equity | $ | $ | |
![]() | CONSOLIDATED FINANCIAL STATEMENTS | 3 |
CONSOLIDATED STATEMENTS OF OPERATIONS | |||||||
Three Months Ended September 30, | Nine Months Ended September 30, | ||||||
(In millions, except per share amounts; Unaudited) | 2026 | 2025 | 2026 | 2025 | |||
Revenues | |||||||
New vehicle | $ | $ | $ | $ | |||
Used vehicle | |||||||
Finance and insurance | |||||||
Aftersales | |||||||
Total revenues | |||||||
Cost of sales | |||||||
New vehicle retail | |||||||
Used vehicle retail | |||||||
Aftersales | |||||||
Total cost of sales | |||||||
Gross profit | |||||||
Finance operations income | |||||||
Selling, general and administrative | |||||||
Depreciation and amortization | |||||||
Operating profit | |||||||
Floor plan interest expense | ( | ( | ( | ( | |||
Other interest expense, net | ( | ( | ( | ( | |||
Other income (expense), net | ( | ||||||
Income before income taxes | |||||||
Income tax provision | ( | ( | ( | ( | |||
Net income | |||||||
Net income attributable to non-controlling interest | ( | ( | ( | ( | |||
Net income attributable to Lithia Motors, Inc. | $ | $ | $ | $ | |||
Basic earnings per share attributable to Lithia Motors, Inc. common stockholders | $ | $ | $ | $ | |||
Shares used in basic per share calculations | |||||||
Diluted earnings per share attributable to Lithia Motors, Inc. common stockholders | $ | $ | $ | $ | |||
Shares used in diluted per share calculations | |||||||
Cash dividends paid per share | $ | $ | $ | $ | |||
![]() | CONSOLIDATED FINANCIAL STATEMENTS | 4 |
CONSOLIDATED STATEMENTS OF COMPREHENSIVE INCOME | |||||||
Three Months Ended September 30, | Nine Months Ended September 30, | ||||||
(In millions; Unaudited) | 2026 | 2025 | 2026 | 2025 | |||
Net income | $ | $ | $ | $ | |||
Other comprehensive (loss) income, net of tax: | |||||||
Foreign currency translation adjustment | ( | ( | |||||
Unrealized (loss) gain on debt securities, net of tax benefit (provision) of $ | ( | ( | |||||
Gain (loss) on cash flow hedges, net of tax (provision) benefit of $( | ( | ||||||
Total other comprehensive (loss) income, net of tax | ( | ( | ( | ||||
Comprehensive income | |||||||
Comprehensive income attributable to non-controlling interest | ( | ( | ( | ( | |||
Comprehensive income attributable to Lithia Motors, Inc. | $ | $ | $ | $ | |||
![]() | CONSOLIDATED FINANCIAL STATEMENTS | 5 |
CONSOLIDATED STATEMENTS OF EQUITY | |||||||
Three Months Ended September 30, | Nine Months Ended September 30, | ||||||
(In millions; Unaudited) | 2026 | 2025 | 2026 | 2025 | |||
Total equity, beginning balances | $ | $ | $ | $ | |||
Common stock, beginning balances | |||||||
Stock-based compensation | |||||||
Issuance of stock in connection with employee stock purchase plans | |||||||
Repurchase of common stock, including excise tax | ( | ( | ( | ( | |||
Common stock, ending balances | |||||||
Additional paid-in capital, beginning balances | |||||||
Stock-based compensation | |||||||
Repurchase of common stock, including excise tax | ( | — | ( | — | |||
Additional paid-in capital, ending balances | |||||||
Accumulated other comprehensive income (loss), beginning balances | ( | ||||||
Foreign currency translation adjustment | ( | ( | |||||
Unrealized (loss) gain on debt securities, net of tax benefit (provision) of $ | ( | ( | |||||
Gain (loss) on cash flow hedges, net of tax (provision) benefit of $( | — | ( | |||||
Accumulated other comprehensive income, ending balances | |||||||
Retained earnings, beginning balances | |||||||
Net income attributable to Lithia Motors, Inc. | |||||||
Dividends paid | ( | ( | ( | ( | |||
Repurchase of common stock, including excise tax | ( | — | ( | — | |||
Retained earnings, ending balances | |||||||
Non-controlling interest, beginning balances | |||||||
Distribution of non-controlling interest | ( | ( | ( | ( | |||
Net income attributable to non-controlling interest | |||||||
Non-controlling interest, ending balances | |||||||
Total equity, ending balances | $ | $ | $ | $ | |||
![]() | CONSOLIDATED FINANCIAL STATEMENTS | 6 |
CONSOLIDATED STATEMENTS OF CASH FLOWS | |||
Nine Months Ended September 30, | |||
(In millions; Unaudited) | 2026 | 2025 | |
Cash flows from operating activities: | |||
Net income | $ | $ | |
Adjustments to reconcile net income to net cash (used in) provided by operating activities: | |||
Depreciation and amortization | |||
Stock-based compensation | |||
Net loss on disposal of other assets | |||
Net gain on disposal of stores | ( | ( | |
Unrealized investment gain, net | ( | ( | |
Deferred income taxes | |||
Amortization of operating lease right-of-use assets | |||
Decrease (increase) (net of acquisitions and dispositions): | |||
Accounts receivable, net | |||
Inventories | ( | ||
Finance receivables | ( | ( | |
Other assets | ( | ( | |
Increase (decrease) (net of acquisitions and dispositions): | |||
Floor plan notes payable | ( | ||
Trade payables | ( | ||
Accrued liabilities | |||
Other long-term liabilities and deferred revenue | |||
Net cash (used in) provided by operating activities | ( | ||
Cash flows from investing activities: | |||
Principal payments received on notes receivable | |||
Capital expenditures | ( | ( | |
Proceeds from sales of assets | |||
Net cash used for other investments | ( | ( | |
Cash paid for acquisitions, net of cash acquired | ( | ( | |
Net proceeds from sales of stores | |||
Net cash used in investing activities | ( | ( | |
Cash flows from financing activities: | |||
Borrowings on floor plan notes payable, net: non-trade | |||
Borrowings on lines of credit | |||
Repayments on lines of credit | ( | ( | |
Principal payments on long-term debt and finance lease liabilities, scheduled | ( | ( | |
Principal payments on long-term debt and finance lease liabilities, other | ( | ( | |
Proceeds from issuance of long-term debt | |||
Principal payments on non-recourse notes payable | ( | ( | |
Proceeds from issuance of non-recourse notes payable | |||
Payment of debt issuance costs | ( | ( | |
Proceeds from issuance of common stock | |||
Repurchase of common stock | ( | ( | |
Dividends paid | ( | ( | |
Payment of contingent consideration related to acquisitions | ( | ||
Other financing activity | ( | ( | |
Net cash provided by financing activities | |||
Effect of exchange rate changes on cash, restricted cash, and cash equivalents | ( | ||
Increase in cash, restricted cash, and cash equivalents | |||
Cash, restricted cash, and cash equivalents at beginning of year | |||
Cash, restricted cash, and cash equivalents at end of period | $ | $ | |
![]() | CONSOLIDATED FINANCIAL STATEMENTS | 7 |
SUPPLEMENTAL DISCLOSURES OF CASH FLOW INFORMATION | |||
Nine Months Ended September 30, | |||
(In millions) | 2026 | 2025 | |
Reconciliation of cash, restricted cash, and cash equivalents to the consolidated balance sheets | |||
Cash and cash equivalents | $ | $ | |
Restricted cash from collections on auto loans receivable and customer deposits | |||
Cash, restricted cash, and cash equivalents | |||
Restricted cash on deposit in reserve accounts, included in other non-current assets | |||
Total cash, restricted cash, and cash equivalents reported in the Consolidated Statements of Cash Flows | $ | $ | |
Supplemental cash flow information: | |||
Cash paid during the period for interest | $ | $ | |
Cash paid during the period for income taxes, net | |||
Debt paid in connection with store disposals | |||
Non-cash activities: | |||
Debt assumed in connection with acquisitions | $ | $ | |
Acquisition of finance leases in connection with acquisitions | |||
Right-of-use assets obtained in exchange for lease liabilities | |||
Unsettled repurchases of common stock and excise taxes | |||
Issuance of notes receivable in connection with divestitures | |||
![]() | NOTES TO CONSOLIDATED FINANCIAL STATEMENTS | 8 |
(In millions) | September 30, 2026 | December 31, 2025 | |
Contracts in transit | $ | $ | |
Vehicle receivables | |||
Manufacturer receivables | |||
Trade receivables | |||
Other receivables, current | |||
Less: Allowance for doubtful accounts | ( | ( | |
Total accounts receivable, net | $ | $ |
(In millions) | September 30, 2026 | December 31, 2025 | |
New vehicles | $ | $ | |
Used vehicles | |||
Parts and accessories | |||
Total inventories | $ | $ |
![]() | NOTES TO CONSOLIDATED FINANCIAL STATEMENTS | 9 |
(In millions) | September 30, 2026 | December 31, 2025 | |
Floor plan notes payable | $ | $ | |
Floor plan notes payable: non-trade | |||
Total floor plan debt | $ | $ |
(In millions) | September 30, 2026 | December 31, 2025 | |
Asset-backed term funding | $ | $ | |
Warehouse facilities | |||
Other managed receivables | |||
Total finance receivables | |||
Accrued interest and fees | |||
Less: Allowance for credit losses | ( | ( | |
Finance receivables, net | $ | $ |
As of September 30, 2026 | |||||||||||||
Year of Origination | |||||||||||||
($ in millions) | 2026 | 2025 | 2024 | 2023 | 2022 | Prior to 2022 | Total | ||||||
<599 | $ | $ | $ | $ | $ | $ | $ | ||||||
600-699 | |||||||||||||
700-774 | |||||||||||||
775+ | |||||||||||||
Total auto loan receivables | $ | $ | $ | $ | $ | $ | |||||||
Other finance receivables 1 | |||||||||||||
Total finance receivables | $ | ||||||||||||
As of December 31, 2025 | |||||||||||||
Year of Origination | |||||||||||||
($ in millions) | 2025 | 2024 | 2023 | 2022 | 2021 | Prior to 2021 | Total | ||||||
<599 | $ | $ | $ | $ | $ | $ | $ | ||||||
600-699 | |||||||||||||
700-774 | |||||||||||||
775+ | |||||||||||||
Total auto loan receivables | $ | $ | $ | $ | $ | $ | |||||||
Other finance receivables 1 | |||||||||||||
Total finance receivables | $ | ||||||||||||
![]() | NOTES TO CONSOLIDATED FINANCIAL STATEMENTS | 10 |
Nine Months Ended September 30, | 2026 vs. 2025 | ||||||
(In millions) | 2026 | 2025 | $ Change | % Change | |||
Allowance for credit losses at beginning of period | $ | $ | $ | ||||
Charge-offs | ( | ( | ( | ||||
Recoveries | ( | ( | |||||
Net charge-offs | ( | ( | ( | ||||
Change in provision due to portfolio size | ( | ( | |||||
Change in provision due to net charge-offs | ( | ( | |||||
Currency translation | ( | ( | ( | ||||
Allowance for credit losses at end of period | $ | $ | $ | ||||
Nine Months Ended September 30, | |||
(In millions) | 2026 | 2025 | |
2026 | $ | $ | |
2025 | |||
2024 | |||
2023 | |||
2022 | |||
2021 and prior | |||
Other finance receivables 1 | |||
Total charge-offs | $ | $ | |
(In millions) | Vehicle Operations | Financing Operations | Consolidated | ||
Balance as of December 31, 2024 | $ | $ | $ | ||
Additions through acquisitions 1 | |||||
Reductions through disposals | ( | ( | |||
Currency translation | |||||
Balance as of December 31, 2025 | |||||
Additions through acquisitions 2 | |||||
Reductions through disposals | ( | ( | |||
Currency translation | ( | ( | ( | ||
Balance as of September 30, 2026 | $ | $ | $ |
![]() | NOTES TO CONSOLIDATED FINANCIAL STATEMENTS | 11 |
(In millions) | Franchise Value |
Balance as of December 31, 2024 | $ |
Additions through acquisitions 1 | |
Reductions through divestitures | ( |
Reductions from impairments 2 | ( |
Currency translation | |
Balance as of December 31, 2025 | |
Additions through acquisitions 3 | |
Reductions through divestitures | ( |
Currency translation | ( |
Balance as of September 30, 2026 | $ |
As of September 30, 2026 | |||||||||||||
Fair Value of Securities with Contractual Maturities | |||||||||||||
(In millions) | Amortized Cost | Total Net Gains1 | Total Net Losses1 | Fair Value | Within 1 Year | After 1 Year through 5 Years | After 5 Years | ||||||
U.S. Treasury | $ | $ | $( | $ | $ | $ | $ | ||||||
Municipal securities | ( | ||||||||||||
Corporate debt | ( | ||||||||||||
Total | $ | $ | $( | $ | $ | $ | $ | ||||||
As of December 31, 2025 | |||||||||||||
Fair Value of Securities with Contractual Maturities | |||||||||||||
(In millions) | Amortized Cost | Total Net Gains1 | Total Net Losses1 | Fair Value | Within 1 Year | After 1 Year through 5 Years | After 5 Years | ||||||
U.S. Treasury | $ | $ | $ | $ | $ | $ | $ | ||||||
Municipal securities | |||||||||||||
Corporate debt | |||||||||||||
Total | $ | $ | $ | $ | $ | $ | $ | ||||||
![]() | NOTES TO CONSOLIDATED FINANCIAL STATEMENTS | 12 |
![]() | NOTES TO CONSOLIDATED FINANCIAL STATEMENTS | 13 |
Commitment | Annual Interest Rate at September 30, 2026 |
New vehicle floor plan | |
Used vehicle floor plan | |
Service loaner floor plan | |
Revolving line of credit |
Commitment | Annual Interest Rate at September 30, 2026 |
Wholesale flooring facility | |
Used vehicle flooring facility | |
Daily rental facility | |
Wholesale leasing facility | |
Working capital revolving facility |
![]() | NOTES TO CONSOLIDATED FINANCIAL STATEMENTS | 14 |
($ in millions) | Balance as of September 30, 2026 | Initial Principal Amount | Issuance Date | Interest Rate Range | Final Distribution Date | |||||
LAD Auto Receivables Trust 2023-1 Class D | 02/14/23 | Various dates through Jun 2030 | ||||||||
LAD Auto Receivables Trust 2023-2 Class C-D | 05/24/23 | Various dates through Feb 2031 | ||||||||
LAD Auto Receivables Trust 2023-3 Class C-D | 08/23/23 | Various dates through Dec 2030 | ||||||||
LAD Auto Receivables Trust 2023-4 Class B-D | 11/15/23 | Various dates through Apr 2031 | ||||||||
LAD Auto Receivables Trust 2024-1 Class A-D | 02/14/24 | Various dates through Jun 2031 | ||||||||
LAD Auto Receivables Trust 2024-2 Class A-D | 06/20/24 | Various dates through Oct 2031 | ||||||||
LAD Auto Receivables Trust 2024-3 Class A-D | 11/15/24 | Various dates through Feb 2032 | ||||||||
LAD Auto Receivables Trust 2025-1 Class A-D | 02/12/25 | Various dates through May 2032 | ||||||||
LAD Auto Receivables Trust 2025-2 Class A-D | 08/13/25 | Various dates through Dec 2032 | ||||||||
LAD Auto Receivables Trust 2025-3 Class A-C | 11/13/25 | Various dates through Mar 2033 | ||||||||
LAD Auto Receivables Trust 2026-1 Class A-C | 02/18/26 | Various dates through Aug 2033 | ||||||||
LAD Auto Receivables Trust 2026-2 Class A-C | 05/13/26 | Various dates through Oct 2033 | ||||||||
LAD Select Auto Receivables Trust 2026-A Class A-E | 07/29/26 | Various dates through June 2034 | ||||||||
Total non-recourse notes payable | $ | $ |
Three Months Ended September 30, | Nine Months Ended September 30, | ||||||
(In millions) | 2026 | 2025 | 2026 | 2025 | |||
Interest cost | $ | $ | $ | $ | |||
Expected return on plan assets | ( | ( | ( | ( | |||
Amortization of net loss | |||||||
Net periodic benefit | $( | $( | $( | $( | |||
![]() | NOTES TO CONSOLIDATED FINANCIAL STATEMENTS | 15 |
Repurchases Occurring in 2026 | Cumulative Repurchases as of September 30, 2026 | ||||||
Shares | Average Price1 | Shares | Average Price | ||||
Share Repurchase Authorization | $ | $ | |||||
![]() | NOTES TO CONSOLIDATED FINANCIAL STATEMENTS | 16 |
As of September 30, 2026 | As of December 31, 2025 | ||||||||||||||
(In millions) | Carrying Value | Level 1 | Level 2 | Level 3 | Carrying Value | Level 1 | Level 2 | Level 3 | |||||||
Recorded at fair value | |||||||||||||||
Marketable securities | |||||||||||||||
Restricted cash - collections | $ | $ | $ | $ | $ | $ | $ | $ | |||||||
Restricted cash - reserve | |||||||||||||||
Total money market funds | $ | $ | $ | $ | $ | $ | $ | $ | |||||||
Equity securities | $ | $ | $ | $ | $ | $ | $ | $ | |||||||
U.S. Treasury | $ | $ | $ | $ | $ | $ | $ | $ | |||||||
Municipal debt | |||||||||||||||
Corporate debt | |||||||||||||||
Total debt securities | $ | $ | $ | $ | $ | $ | $ | $ | |||||||
Equity Method Investment | |||||||||||||||
PINE.L | $ | $ | $ | $ | $ | $ | $ | $ | |||||||
Recorded at historical value | |||||||||||||||
Fixed rate debt 1 | |||||||||||||||
$ | $ | $ | $ | $ | $ | $ | $ | ||||||||
Non-recourse notes payable | |||||||||||||||
Real estate mortgages and other debt | |||||||||||||||
![]() | NOTES TO CONSOLIDATED FINANCIAL STATEMENTS | 17 |
Nine Months Ended September 30, | 2026 |
Revenue | $ |
Operating income |
(In millions) | Consideration |
Cash paid, net of cash acquired | $ |
Total consideration transferred | $ |
(In millions) | Assets Acquired and Liabilities Assumed |
Accounts receivables, net | $ |
Inventories, net | |
Property and equipment | |
Operating lease right-of-use assets | |
Other assets | |
Floor plan notes payable assumed | ( |
Trade payables | ( |
Finance lease obligations assumed | ( |
Deferred taxes, net | ( |
Other liabilities and deferred revenue | ( |
Total net assets acquired and liabilities assumed | $ |
![]() | NOTES TO CONSOLIDATED FINANCIAL STATEMENTS | 18 |
Three Months Ended September 30, | Nine Months Ended September 30, | ||||||
(In millions, except per share amounts) | 2026 | 2025 | 2026 | 2025 | |||
Revenue | $ | $ | $ | $ | |||
Net income attributable to Lithia Motors, Inc. | |||||||
Basic EPS attributable to Lithia Motors, Inc. common stockholders | |||||||
Diluted EPS attributable to Lithia Motors, Inc. common stockholders | |||||||
Three Months Ended September 30, | Nine Months Ended September 30, | ||||||
(In millions, except per share amounts) | 2026 | 2025 | 2026 | 2025 | |||
Net income attributable to Lithia Motors, Inc. | $ | $ | $ | $ | |||
Weighted average common shares outstanding – basic | |||||||
Effect of employee stock purchases and restricted stock units on weighted average common shares outstanding | |||||||
Weighted average common shares outstanding – diluted | |||||||
Basic EPS attributable to Lithia Motors, Inc. common stockholders | $ | $ | $ | $ | |||
Diluted EPS attributable to Lithia Motors, Inc. common stockholders | $ | $ | $ | $ | |||
![]() | NOTES TO CONSOLIDATED FINANCIAL STATEMENTS | 19 |
Three Months Ended September 30, | Nine Months Ended September 30, | ||||||
(In millions) | 2026 | 2025 | 2026 | 2025 | |||
Vehicle operations | |||||||
Total revenue | $ | $ | $ | $ | |||
Total gross profit | |||||||
Floor plan interest expense | ( | ( | ( | ( | |||
Personnel expense | ( | ( | ( | ( | |||
Rent and facility expense | ( | ( | ( | ( | |||
Advertising expense | ( | ( | ( | ( | |||
Other vehicle operations expenses1 | ( | ( | ( | ( | |||
Vehicle operations income | |||||||
Financing Operations | |||||||
Interest and fee income | |||||||
Interest expense | ( | ( | ( | ( | |||
Total interest margin | |||||||
Lease income | |||||||
Lease costs | ( | ( | ( | ( | |||
Lease income, net | |||||||
Provision expense | ( | ( | ( | ( | |||
Other financing operations expenses2 | ( | ( | ( | ( | |||
Financing operations income | |||||||
Total segment income for reportable segments | |||||||
Corporate and other3 | |||||||
Depreciation and amortization | ( | ( | ( | ( | |||
Other interest expense | ( | ( | ( | ( | |||
Other income (expense), net | ( | ||||||
Income before income taxes | $ | $ | $ | $ | |||
![]() | NOTES TO CONSOLIDATED FINANCIAL STATEMENTS | 20 |
Three Months Ended September 30, | Nine Months Ended September 30, | ||||||
(In millions) | 2026 | 2025 | 2026 | 2025 | |||
Revenue from external customers: | |||||||
United States | $ | $ | $ | $ | |||
United Kingdom | |||||||
Canada | |||||||
Total revenue from external customers | $ | $ | $ | $ | |||
![]() | MANAGEMENT’S DISCUSSION AND ANALYSIS | 21 |
![]() | MANAGEMENT’S DISCUSSION AND ANALYSIS | 22 |
![]() | MANAGEMENT’S DISCUSSION AND ANALYSIS | 23 |


![]() | MANAGEMENT’S DISCUSSION AND ANALYSIS | 24 |
Three Months Ended September 30, | Nine Months Ended September 30, | ||||||||||
($ in millions, except per unit values) | 2026 | 2025 | Change | 2026 | 2025 | Change | |||||
Revenues | |||||||||||
New vehicle | $4,868.6 | $4,792.4 | 1.6 % | $14,077.1 | $14,076.3 | — % | |||||
Used vehicle | 3,630.1 | 3,463.3 | 4.8 | 10,647.8 | 10,192.3 | 4.5 | |||||
Finance and insurance | 361.4 | 378.6 | (4.5) | 1,087.5 | 1,116.8 | (2.6) | |||||
Aftersales | 1,086.6 | 1,041.5 | 4.3 | 3,197.0 | 3,051.7 | 4.8 | |||||
Total revenues | 9,946.7 | 9,675.8 | 2.8 | $29,009.4 | $28,437.1 | 2.0 | |||||
Gross profit | |||||||||||
New vehicle | $277.9 | $291.4 | (4.6) % | $821.4 | $898.2 | (8.6) % | |||||
Used vehicle | 210.9 | 189.2 | 11.5 | 612.6 | 583.1 | 5.1 | |||||
Finance and insurance | 361.4 | 378.6 | (4.5) | 1,087.5 | 1,116.7 | (2.6) | |||||
Aftersales | 645.6 | 606.8 | 6.4 | 1,893.4 | 1,763.5 | 7.4 | |||||
Total gross profit | 1,495.8 | 1,466.0 | 2.0 | $4,414.9 | $4,361.5 | 1.2 | |||||
Gross profit margins | |||||||||||
New vehicle | 5.7% | 6.1% | (40) bps | 5.8% | 6.4% | (60) bps | |||||
Used vehicle | 5.8 | 5.5 | 30 | 5.8 | 5.7 | 10 | |||||
Finance and insurance | 100.0 | 100.0 | — | 100.0 | 100.0 | — | |||||
Aftersales | 59.4 | 58.3 | 110 | 59.2 | 57.8 | 140 | |||||
Total gross profit margin | 15.0 | 15.2 | (20) | 15.2 | 15.3 | (10) | |||||
Units sold | |||||||||||
New vehicle | 105,471 | 104,332 | 1.1 % | 304,347 | 305,151 | (0.3) % | |||||
Used vehicle retail | 109,791 | 109,097 | 0.6 | 326,056 | 325,476 | 0.2 | |||||
Average selling price per unit (excluding agency) | |||||||||||
New vehicle | $46,777 | $46,804 | (0.1) % | $46,938 | $47,165 | (0.5) % | |||||
Used vehicle retail | 29,499 | 28,381 | 3.9 | 29,180 | 27,990 | 4.3 | |||||
Average gross profit per unit | |||||||||||
New vehicle | $2,635 | $2,793 | (5.7)% | $2,699 | $2,943 | (8.3)% | |||||
Used vehicle retail | 1,970 | 1,773 | 11.1 | 1,889 | 1,818 | 3.9 | |||||
Finance and insurance | 1,733 | 1,818 | (4.7) | 1,782 | 1,814 | (1.8) | |||||
Total vehicle 1 | 3,949 | 4,025 | (1.9) | 4,000 | 4,120 | (2.9) | |||||
![]() | MANAGEMENT’S DISCUSSION AND ANALYSIS | 25 |
Three Months Ended September 30, | Nine Months Ended September 30, | ||||||||||
($ in millions, except per unit values) | 2026 | 2025 | Change | 2026 | 2025 | Change | |||||
Revenues | |||||||||||
New vehicle | $4,608.3 | $4,729.9 | (2.6) % | $13,293.7 | $13,784.0 | (3.6) % | |||||
Used vehicle | 3,419.4 | 3,409.5 | 0.3 | 10,023.4 | 9,932.6 | 0.9 | |||||
Finance and insurance | 345.1 | 375.6 | (8.1) | 1,039.6 | 1,102.0 | (5.7) | |||||
Aftersales | 1,027.9 | 1,021.0 | 0.7 | 3,018.5 | 2,964.1 | 1.8 | |||||
Total revenues | 9,400.6 | 9,536.0 | (1.4) | $27,375.2 | $27,782.8 | (1.5) | |||||
Gross profit | |||||||||||
New vehicle | $263.9 | $288.4 | (8.5) % | $778.0 | $881.6 | (11.8) % | |||||
Used vehicle | 203.1 | 185.8 | 9.3 | 586.6 | 575.2 | 2.0 | |||||
Finance and insurance | 345.1 | 375.6 | (8.1) | 1,039.6 | 1,102.0 | (5.7) | |||||
Aftersales | 611.1 | 596.9 | 2.4 | 1,786.0 | 1,721.2 | 3.8 | |||||
Total gross profit | 1,423.2 | 1,446.7 | (1.6) | $4,190.2 | $4,280.1 | (2.1) | |||||
Gross profit margins | |||||||||||
New vehicle | 5.7% | 6.1% | (40) bps | 5.9% | 6.4% | (50) bps | |||||
Used vehicle | 5.9 | 5.4 | 50 | 5.9 | 5.8 | 10 | |||||
Finance and insurance | 100.0 | 100.0 | — | 100.0 | 100.0 | — | |||||
Aftersales | 59.5 | 58.5 | 100 | 59.2 | 58.1 | 110 | |||||
Total gross profit margin | 15.1 | 15.2 | (10) | 15.3 | 15.4 | (10) | |||||
Units sold | |||||||||||
New vehicles | 100,559 | 103,318 | (2.7) % | 289,351 | 300,917 | (3.8) % | |||||
Used vehicle retail | 104,612 | 108,039 | (3.2) | 311,741 | 320,566 | (2.8) | |||||
Average selling price per unit (excluding agency) | |||||||||||
New vehicles | $46,470 | $46,652 | (0.4) % | $46,659 | $46,843 | (0.4) % | |||||
Used vehicle retail | 29,197 | 28,200 | 3.5 | 28,770 | 27,703 | 3.9 | |||||
Average gross profit per unit | |||||||||||
New vehicles | $2,624 | $2,792 | (6.0)% | $2,689 | $2,930 | (8.2)% | |||||
Used vehicle retail | 1,993 | 1,759 | 13.3 | 1,893 | 1,818 | 4.1 | |||||
Finance and insurance | 1,736 | 1,821 | (4.7) | 1,784 | 1,816 | (1.8) | |||||
Total vehicle 1 | 3,958 | 4,021 | (1.6) | 4,000 | 4,117 | (2.8) | |||||
![]() | MANAGEMENT’S DISCUSSION AND ANALYSIS | 26 |
![]() | MANAGEMENT’S DISCUSSION AND ANALYSIS | 27 |
![]() | MANAGEMENT’S DISCUSSION AND ANALYSIS | 28 |
Three Months Ended September 30, | Nine Months Ended September 30, | ||||||||||||||
($ in millions) | 2026 | % (1) | 2025 | % (1) | 2026 | % 1 | 2025 | % 1 | |||||||
Interest and fee income | $122.1 | 8.7 | $104.9 | 9.2 | $349.0 | 8.8 | $298.0 | 9.2 | |||||||
Interest expense | (56.3) | (4.0) | (52.1) | (4.6) | (161.4) | (4.1) | (150.0) | (4.6) | |||||||
Total interest margin | 65.8 | 4.7 | 52.8 | 4.6 | 187.6 | 4.7 | 148.0 | 4.6 | |||||||
Lease income | 29.2 | 23.4 | 79.5 | 67.7 | |||||||||||
Lease costs | (25.6) | (18.6) | (68.3) | (54.0) | |||||||||||
Lease income, net | 3.6 | 4.8 | 11.2 | 13.7 | |||||||||||
Provision expense | (22.5) | (1.6) | (25.8) | (2.3) | (64.7) | (1.6) | (72.5) | (2.2) | |||||||
Other financing operations expenses | (14.6) | (1.0) | (12.7) | (1.1) | (44.1) | (1.1) | (37.5) | (1.2) | |||||||
Finance operations income | $32.3 | $19.1 | $90.0 | $51.7 | |||||||||||
Total average managed finance receivables | $5,558.0 | $4,541.8 | $5,290.6 | $4,316.3 | |||||||||||
Three Months Ended September 30, | Nine Months Ended September 30, | ||||||
($ in millions) | 2026 | 2025 | 2026 | 2025 | |||
Loan origination information | |||||||
Net loans originated | $936.8 | $731.6 | $2,661.1 | $2,085.0 | |||
Vehicle units financed | 28,622 | 23,546 | 82,706 | 67,971 | |||
Total penetration rate 2 | 18.3% | 14.5% | 17.9% | 14.3% | |||
Weighted average contract rate | 7.9% | 8.6% | 7.9% | 8.8% | |||
Weighted average credit score 3 | 752 | 746 | 750 | 746 | |||
Weighted average FE LTV 4 | 94.6% | 95.0% | 95.1% | 95.0% | |||
Weighted average term (in months) | 72 | 73 | 72 | 73 | |||
Loan performance information | |||||||
Allowance for loan losses as a percentage of ending managed receivables | 2.8% | 3.1% | 2.8% | 3.1% | |||
Net credit losses on managed receivables | $16.8 | $20.6 | $47.8 | $54.1 | |||
Annualized net credit losses as a percentage of total average managed receivables | 1.3% | 1.9% | 1.3% | 1.8% | |||
Past due accounts as a percentage of ending managed receivables 5 | 3.3% | 4.1% | 3.3% | 4.1% | |||
Average recovery rate 6 | 47.5% | 46.5% | 48.5% | 45.8% | |||
![]() | MANAGEMENT’S DISCUSSION AND ANALYSIS | 29 |
Three Months Ended September 30, | Increase | % Increase | |||||
($ in millions) | 2026 | 2025 | |||||
Personnel | $629.2 | $619.6 | $9.6 | 1.5% | |||
Rent and facility costs | 111.8 | 107.6 | 4.2 | 3.9 | |||
Advertising | 70.1 | 64.9 | 5.2 | 8.0 | |||
Other | 225.2 | 205.9 | 19.3 | 9.4 | |||
Total SG&A | $1,036.3 | $998.0 | $38.3 | 3.8% | |||
Three Months Ended September 30, | Increase (Decrease) | ||||
As a % of gross profit | 2026 | 2025 | |||
Personnel | 42.1% | 42.3% | (20)bps | ||
Rent and facility costs | 7.5 | 7.3 | 20 | ||
Advertising | 4.7 | 4.4 | 30 | ||
Other | 15.0 | 14.1 | 90 | ||
Total SG&A | 69.3% | 68.1% | 120bps | ||
Nine Months Ended September 30, | Increase | % Increase | |||||
($ in millions) | 2026 | 2025 | |||||
Personnel | $1,896.0 | $1,868.0 | $28.0 | 1.5% | |||
Rent and facility costs | 325.4 | 306.2 | 19.2 | 6.3 | |||
Advertising | 211.1 | 190.2 | 20.9 | 11.0 | |||
Other | 655.9 | 600.9 | 55.0 | 9.2 | |||
Total SG&A | $3,088.4 | $2,965.3 | $123.1 | 4.2% | |||
![]() | MANAGEMENT’S DISCUSSION AND ANALYSIS | 30 |
Nine Months Ended September 30, | Increase | ||||
As a % of gross profit | 2026 | 2025 | |||
Personnel | 42.9% | 42.8% | 10bps | ||
Rent and facility costs | 7.4 | 7.0 | 40 | ||
Advertising | 4.8 | 4.4 | 40 | ||
Other | 14.9 | 13.8 | 110 | ||
Total SG&A | 70.0% | 68.0% | 200bps | ||
Three Months Ended September 30, | Increase | % Increase | |||||
($ in millions) | 2026 | 2025 | |||||
Personnel | $629.2 | $619.6 | $9.6 | 1.5% | |||
Rent and facility costs | 111.8 | 107.6 | 4.2 | 3.9 | |||
Advertising | 70.1 | 64.9 | 5.2 | 8.0 | |||
Adjusted other | 218.6 | 203.0 | 15.6 | 7.7 | |||
Adjusted total SG&A | $1,029.7 | $995.1 | $34.6 | 3.5% | |||
Three Months Ended September 30, | Increase (Decrease) | ||||
As a % of gross profit | 2026 | 2025 | |||
Personnel | 42.1% | 42.3% | (20)bps | ||
Rent and facility costs | 7.5 | 7.3 | 20 | ||
Advertising | 4.7 | 4.4 | 30 | ||
Adjusted other | 14.5 | 13.9 | 60 | ||
Adjusted total SG&A | 68.8% | 67.9% | 90bps | ||
Nine Months Ended September 30, | Increase | % Increase | |||||
($ in millions) | 2026 | 2025 | |||||
Personnel | $1,896.0 | $1,868.0 | $28.0 | 1.5% | |||
Rent and facility costs | 325.4 | 306.2 | 19.2 | 6.3% | |||
Advertising | 211.1 | 190.2 | 20.9 | 11.0% | |||
Adjusted other | 640.9 | 597.0 | 43.9 | 7.4% | |||
Adjusted total SG&A | $3,073.4 | $2,961.4 | $112.0 | 3.8% | |||
Nine Months Ended September 30, | Increase | ||||
As a % of gross profit | 2026 | 2025 | |||
Personnel | 42.9% | 42.8% | 10bps | ||
Rent and facility costs | 7.4 | 7.0 | 40 | ||
Advertising | 4.8 | 4.4 | 40 | ||
Adjusted other | 14.5 | 13.7 | 80 | ||
Adjusted total SG&A | 69.6% | 67.9% | 170bps | ||
![]() | MANAGEMENT’S DISCUSSION AND ANALYSIS | 31 |
Three Months Ended September 30, | % | ||||||
($ in millions) | 2026 | 2025 | Change | Change | |||
Floor plan interest expense | $70.3 | $57.8 | $12.5 | 21.6% | |||
Nine Months Ended September 30, | % | ||||||
($ in millions) | 2026 | 2025 | Change | Change | |||
Floor plan interest expense | $195.9 | $169.8 | $26.1 | 15.4% | |||
Three Months Ended September 30, | Increase | % Increase | |||||
($ in millions) | 2026 | 2025 | |||||
Depreciation and amortization | $71.6 | $65.5 | $6.1 | 9.3% | |||
Nine Months Ended September 30, | Increase | % Increase | |||||
($ in millions) | 2026 | 2025 | |||||
Depreciation and amortization | $212.3 | $194.6 | $17.7 | 9.1% | |||
![]() | MANAGEMENT’S DISCUSSION AND ANALYSIS | 32 |
Three Months Ended September 30, | |||||
2026 | 2025 | Change | |||
Operating margin | 4.2% | 4.4% | (20) bps | ||
Operating margin adjusted for non-core charges 1 | 4.3% | 4.4% | (10) bps | ||
Nine Months Ended September 30, | |||||
2026 | 2025 | Change | |||
Operating margin | 4.2% | 4.4% | (20) bps | ||
Operating margin adjusted for non-core charges 1 | 4.2% | 4.4% | (20) bps | ||
Three Months Ended September 30, | Increase (Decrease) | % Increase (Decrease) | |||||
($ in millions) | 2026 | 2025 | |||||
Senior notes interest | $27.6 | $21.0 | $6.6 | 31.4% | |||
Mortgage interest | 16.0 | 14.9 | 1.1 | 7.4 | |||
Other interest | 20.5 | 34.7 | (14.2) | (40.9) | |||
Capitalized interest | (1.0) | (2.3) | (1.3) | NM | |||
Total other interest expense | $63.1 | $68.3 | $(5.2) | (7.6)% | |||
Nine Months Ended September 30, | Increase (Decrease) | % Increase (Decrease) | |||||
($ in millions) | 2026 | 2025 | |||||
Senior notes interest | $82.7 | $59.1 | $23.6 | 39.9% | |||
Mortgage interest | 47.6 | 43.4 | 4.2 | 9.7 | |||
Other interest | 69.6 | 104.6 | (35.0) | (33.5) | |||
Capitalized interest | (3.9) | (6.6) | (2.7) | NM | |||
Total other interest expense | $196.0 | $200.5 | $(4.5) | (2.2)% | |||
![]() | MANAGEMENT’S DISCUSSION AND ANALYSIS | 33 |
Three Months Ended September 30, | Increase (Decrease) | % Increase (Decrease) | |||||
($ in millions) | 2026 | 2025 | |||||
Equity method investment | $92.5 | $(19.6) | $112.1 | NM | |||
Foreign currency remeasurement | 0.1 | (2.1) | 2.2 | NM | |||
Net pension benefit | 0.5 | 2.4 | (1.9) | (79.2) | |||
Miscellaneous | 11.1 | 6.0 | 5.1 | 85.0 | |||
Other (expense) income, net | $104.2 | $(13.3) | $117.5 | NM | |||
Nine Months Ended September 30, | Increase (Decrease) | % Increase (Decrease) | |||||
($ in millions) | 2026 | 2025 | |||||
Equity method investments | $53.6 | $11.3 | 42.3 | 374.3 | |||
Foreign currency remeasurements | (4.9) | 3.0 | (7.9) | NM | |||
Net pension benefits | 1.5 | 7.1 | (5.6) | (78.9) | |||
Miscellaneous | 22.5 | 14.5 | 8.0 | 55.2 | |||
Other income, net | $72.7 | $35.9 | $36.8 | 102.5% | |||
Three Months Ended September 30, | Nine Months Ended September 30, | ||||||
2026 | 2025 | 2026 | 2025 | ||||
Effective income tax rate | 25.1% | 22.5% | 25.8% | 25.1% | |||
Effective income tax rate excluding non-core items 1 | 25.7% | 21.7% | 26.4% | 24.6% | |||
![]() | MANAGEMENT’S DISCUSSION AND ANALYSIS | 34 |
Three Months Ended September 30, 2026 | |||||||||||
($ in millions, except per share amounts) | As reported | Net loss on disposal of stores | Investment gain | Insurance reserves | Tax attribute | Adjusted | |||||
Selling, general and administrative | $1,036.3 | $(5.8) | $— | $(0.8) | $— | $1,029.7 | |||||
Operating income | 420.2 | 5.8 | — | 0.8 | — | 426.8 | |||||
Other income (expense), net | 104.2 | — | (88.8) | — | — | 15.4 | |||||
Income (loss) before income taxes | $391.0 | $5.8 | $(88.8) | $0.8 | $— | $308.8 | |||||
Income tax (provision) benefit | (98.1) | (1.6) | 23.7 | (0.2) | (3.3) | (79.5) | |||||
Net income (loss) | 292.9 | 4.2 | (65.1) | 0.6 | (3.3) | 229.3 | |||||
Net income attributable to NCI | (1.8) | — | — | — | — | (1.8) | |||||
Net income (loss) attributable to Lithia Motors, Inc. | $291.1 | $4.2 | $(65.1) | $0.6 | $(3.3) | $227.5 | |||||
Diluted earnings (loss) per share attributable to Lithia Motors, Inc. | $13.22 | $0.19 | $(2.95) | $0.03 | $(0.15) | $10.34 | |||||
Diluted share count | 22.0 | ||||||||||
Three Months Ended September 30, 2025 | |||||||||||||
($ in millions, except per share amounts) | As reported | Net gain on disposal of stores | Investment loss | Insurance reserves | Acquisition expenses | Tax attribute | Adjusted | ||||||
Selling, general and administrative | $998.0 | $15.4 | $— | $(2.5) | $(15.9) | $— | $995.0 | ||||||
Operating income (loss) | 421.6 | (15.4) | — | 2.5 | 15.9 | — | 424.6 | ||||||
Other (expense) income, net | (13.3) | — | 22.7 | — | — | — | 9.4 | ||||||
Income (loss) before income taxes | $282.2 | $(15.4) | $22.7 | $2.5 | $15.9 | $— | $307.9 | ||||||
Income tax (provision) benefit | (63.6) | 7.2 | (6.0) | (0.5) | (0.6) | (3.5) | (67.0) | ||||||
Net income (loss) | 218.6 | (8.2) | 16.7 | 2.0 | 15.3 | (3.5) | 240.9 | ||||||
Net income attributable to NCI | (1.5) | — | — | — | — | — | (1.5) | ||||||
Net income (loss) attributable to Lithia Motors, Inc. | $217.1 | $(8.2) | $16.7 | $2.0 | $15.3 | $(3.5) | $239.4 | ||||||
Diluted earnings (loss) per share attributable to Lithia Motors, Inc. | $8.61 | $(0.32) | $0.66 | $0.08 | $0.61 | $(0.14) | $9.50 | ||||||
Diluted share count | 25.2 | ||||||||||||
![]() | MANAGEMENT’S DISCUSSION AND ANALYSIS | 35 |
Nine Months Ended September 30, 2026 | |||||||||||||||
($ in millions, except per share amounts) | As reported | Net gain on disposal of stores | Investment gain | Insurance reserves | Acquisition expenses | Contract buyouts | Tax attribute | Adjusted | |||||||
Selling, general and administrative | $3,088.4 | $9.2 | $— | $(3.2) | $(0.7) | $(20.3) | $— | $3,073.4 | |||||||
Operating income (loss) | 1,204.2 | (9.2) | — | 3.2 | 0.7 | 20.3 | — | 1,219.2 | |||||||
Other income (expense), net | 72.7 | — | (43.7) | — | — | — | — | 29.0 | |||||||
Income (loss) before income taxes | $885.0 | $(9.2) | $(43.7) | $3.2 | $0.7 | $20.3 | $— | $856.3 | |||||||
Income tax (provision) benefit | (228.4) | 2.4 | 11.6 | (0.9) | (0.1) | (5.1) | (5.3) | (225.8) | |||||||
Net income (loss) | 656.6 | (6.8) | (32.1) | 2.3 | 0.6 | 15.2 | (5.3) | 630.5 | |||||||
Net income attributable to NCI | (5.1) | — | — | — | — | — | — | (5.1) | |||||||
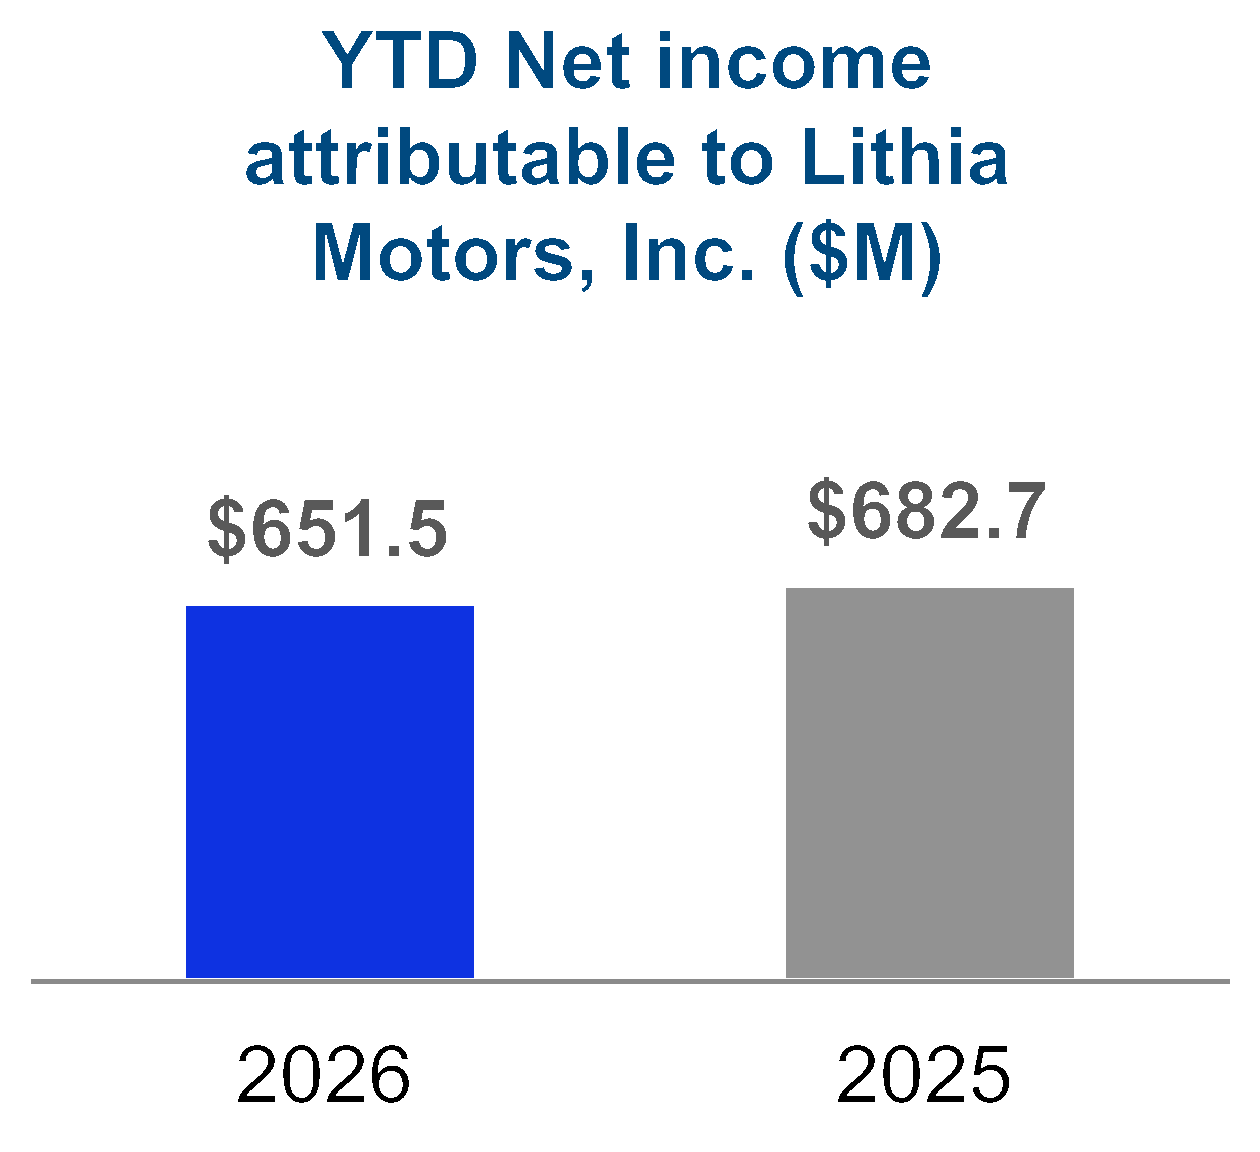
Net income (loss) attributable to Lithia Motors, Inc. | $651.5 | $(6.8) | $(32.1) | $2.3 | $0.6 | $15.2 | $(5.3) | $625.4 | |||||||
Diluted earnings (loss) per share attributable to Lithia Motors, Inc. | $28.77 | $(0.30) | $(1.42) | $0.10 | $0.03 | $0.67 | $(0.24) | $27.61 | |||||||
Diluted share count | 22.6 | ||||||||||||||
Nine Months Ended September 30, 2025 | |||||||||||||
($ in millions, except per share amounts) | As reported | Net gain on disposal of stores | Investment gain | Insurance reserves | Acquisition expenses | Tax attribute | Adjusted | ||||||
Selling, general and administrative | $2,965.3 | $17.7 | $— | $(5.4) | $(16.1) | $— | $2,961.5 | ||||||
Operating income (loss) | 1,253.3 | (17.7) | — | 5.4 | 16.1 | — | 1,257.1 | ||||||
Other income (expense), net | 35.9 | — | (4.1) | — | — | — | 31.8 | ||||||
Income (loss) before income taxes | $918.9 | $(17.7) | $(4.1) | $5.4 | $16.1 | $— | $918.6 | ||||||
Income tax (provision) benefit | (230.9) | 11.6 | 1.0 | (1.4) | (0.6) | (5.7) | (226.0) | ||||||
Net income (loss) | 688.0 | (6.1) | (3.1) | 4.0 | 15.5 | (5.7) | 692.6 | ||||||
Net income attributable to NCI | (5.3) | — | — | — | — | — | (5.3) | ||||||
Net income (loss) attributable to Lithia Motors, Inc. | $682.7 | $(6.1) | $(3.1) | $4.0 | $15.5 | $(5.7) | $687.3 | ||||||
Diluted earnings (loss) per share attributable to Lithia Motors, Inc. | $26.42 | $(0.24) | $(0.12) | $0.16 | $0.60 | $(0.22) | $26.60 | ||||||
Diluted share count | 25.8 | ||||||||||||
![]() | MANAGEMENT’S DISCUSSION AND ANALYSIS | 36 |
($ in millions) | September 30, 2026 | December 31, 2025 | Change | % Change | |||
Cash and cash equivalents | $108.1 | $109.2 | $(1.1) | (1.0)% | |||
Marketable securities | 76.1 | 56.4 | 19.7 | 34.9 | |||
Available credit on credit facilities | 1,256.5 | 1,359.2 | (102.7) | (7.6) | |||
Total current available funds | $1,440.7 | $1,524.8 | $(84.1) | (5.5)% |
Nine Months Ended September 30, | Change | ||||
(In millions) | 2026 | 2025 | in Cash Flow | ||
Net cash (used in) provided by operating activities | $(204.9) | $233.0 | $(437.9) | ||
Net cash used in investing activities | (481.2) | (479.4) | (1.8) | ||
Net cash provided by financing activities | 722.3 | 264.5 | 457.8 | ||
Nine Months Ended September 30, | Change | ||||
(In millions) | 2026 | 2025 | in Cash Flow | ||
Net cash (used in) provided by operating activities – as reported | $(204.9) | $233.0 | $(437.9) | ||
Adjust: Net borrowings on floor plan notes payable, non-trade(1) | 1,542.2 | 73.3 | 1,468.9 | ||
Less: Borrowings on floor plan notes payable, non-trade associated with acquired vehicle inventory | (43.5) | (62.9) | 19.4 | ||
Adjust: Finance receivables activity | 831.4 | 671.3 | 160.1 | ||
Net cash provided by operating activities – adjusted | $2,125.2 | $914.7 | $1,210.5 | ||
![]() | MANAGEMENT’S DISCUSSION AND ANALYSIS | 37 |
Nine Months Ended September 30, | Change | ||||
(In millions) | 2026 | 2025 | in Cash Flow | ||
Capital expenditures | $(252.3) | $(257.7) | $5.4 | ||
Cash paid for acquisitions, net of cash acquired | (264.8) | (417.6) | 152.8 | ||
Net proceeds from sales of stores | 31.9 | 178.1 | (146.2) | ||

![]() | MANAGEMENT’S DISCUSSION AND ANALYSIS | 38 |
Nine Months Ended September 30, | |||
($ in millions) | 2026 | 2025 | |
Number of locations acquired | 12 | 6 | |
Number of stores opened | 5 | 2 | |
Cash paid for acquisitions, net of cash acquired | $(264.8) | $(417.6) | |
Add: Borrowings on floor plan notes payable: non-trade associated with acquired new vehicle inventory | 43.5 | 62.9 | |
Cash paid for acquisitions, net of cash acquired – adjusted | $(221.3) | $(354.7) | |
Nine Months Ended September 30, | Change | ||||
(In millions) | 2026 | 2025 | in Cash Flow | ||
Cash provided by financing activities, as reported | $722.3 | $264.5 | $457.8 | ||
Less: Net borrowings on floor plan notes payable: non-trade (1) | (1,542.2) | (73.3) | (1,468.9) | ||
Less: Net borrowings on non-recourse notes payable | (291.8) | (136.3) | (155.5) | ||
Cash (used in) provided by financing activities, as adjusted | $(1,111.7) | $54.9 | $(1,166.6) | ||
Nine Months Ended September 30, | Change | ||||
(In millions) | 2026 | 2025 | in Cash Flow | ||
Net (repayments) borrowings on lines of credit | $(368.5) | $132.0 | $(500.5) | ||
Proceeds from issuance of long-term debt | — | 741.0 | (741.0) | ||
Principal payments on non-recourse notes payable | (1,228.4) | (959.0) | (269.4) | ||
Proceeds from the issuance of non-recourse notes payable | 1,520.2 | 1,095.3 | 424.9 | ||
Repurchase of common stock | (624.5) | (662.3) | 37.8 | ||
Dividend paid: | Dividend amount per share | Total amount of dividend (in millions) | |
March 2026 | $0.55 | $12.8 | |
May 2026 | $0.57 | $12.9 | |
August 2026 | $0.70 | $15.4 |
![]() | MANAGEMENT’S DISCUSSION AND ANALYSIS | 39 |
As of September 30, 2026 | |||||
(In millions) | Outstanding | Remaining Available | |||
Floor plan notes payable: non-trade | $4,504.2 | $— | (1) | ||
Floor plan notes payable | 2,062.6 | — | |||
Daily rental vehicle inventory financing commitments | 3.5 | 0.4 | (2) | ||
Revolving lines of credit | 1,736.6 | 1,226.7 | (2), (3) | ||
Warehouse facilities | 1,743.5 | 29.4 | |||
Non-recourse notes payable | 2,765.7 | — | |||
4.625% Senior notes due 2027 | 400.0 | — | |||
5.500% Senior notes due 2030 | 600.0 | — | |||
4.375% Senior notes due 2031 | 550.0 | — | |||
3.875% Senior notes due 2029 | 800.0 | — | |||
Real estate mortgages, finance lease obligations, and other debt | 1,114.6 | — | |||
Unamortized debt issuance costs | (24.4) | — | (4) | ||
Total debt | 16,256.3 | $1,256.5 | |||
Less: Inventory related debt | (6,570.3) | ||||
Less: Financing operations related debt | (4,509.2) | ||||
Less: Unrestricted cash and cash equivalents | (108.1) | ||||
Less: Marketable securities | (76.1) | ||||
Less: Availability on daily rental financing facilities | (0.4) | ||||
Net debt(5) | $4,992.2 | ||||
![]() | 40 |
For the full calendar month of | Total number of shares purchased2 | Average price paid per share | Total number of shares purchased as part of publicly announced plans1 | Maximum dollar value of shares that may yet be purchased under publicly announced plan | |||
July | — | $— | — | $620,491 | |||
August | 60,564 | 371.14 | 60,483 | 598,044 | |||
September | 185,753 | 337.02 | 185,753 | 535,442 | |||
Total | 246,317 | 345.41 | 246,236 |
![]() | 41 |
Incorporated by Reference | Filed or Furnished Herewith | |||||||||||
Exhibit Number | Exhibit Description | Form | File Number | Exhibit | Filing Date | |||||||
Restated Articles of Incorporation of Lithia Motors, Inc. | 10-Q | 001-14733 | 3.1 | 07/28/21 | ||||||||
Bylaws of Lithia Motors, Inc. | 8-K | 001-14733 | 3.1 | 02/20/26 | ||||||||
Certification of Chief Executive Officer pursuant to Rule 13a-14(a) of the Securities Exchange Act of 1934. | X | |||||||||||
Certification of Chief Financial Officer pursuant to Rule 13a-14(a) of the Securities Exchange Act of 1934. | X | |||||||||||
Certification of Chief Executive Officer pursuant to Rule 13a-14(b) of the Securities Exchange Act of 1934 and 18 U.S.C. Section 1350. | X | |||||||||||
Certification of Chief Financial Officer pursuant to Rule 13a-14(b) of the Securities Exchange Act of 1934 and 18 U.S.C. Section 1350. | X | |||||||||||
101 | Inline XBRL Document Set for the consolidated financial statements and accompanying notes to consolidated financial statements. | X | ||||||||||
104 | Cover page formatted as Inline XBRL and contained in Exhibit 101. | X | ||||||||||
![]() | 42 |
Date: October 28, 2026 | LITHIA MOTORS, INC. | |
Registrant | ||
By: | /s/ Tina Miller | |
Tina Miller | ||
Chief Financial Officer, Senior Vice President, and Principal Accounting Officer | ||