
Exhibit 99.2
1H 2026 Financial Results Nasdaq: CSHR September 2026

Disclaimers — Forward - Looking Statements In addition, this communication includes certain hypothetical scenarios that are illustrative based on assumed digital asset prices and estimates regarding the potential inclusion of CoinShares' securities in one or more securities indices and the potential share demand that may result from such inclusion . These hypotheticals and estimates are for synthesizing the information presented in this communication and demonstrating the potential impact of the unique factors affecting the period . They do not constitute guidance, a forecast, projection, prediction, or estimate of future performance . Actual results may differ materially from those illustrated, even if the digital asset pricing assumptions shown are r 2 ealized . There can be no assurance that CoinShares will be included in any securities index . This communication includes forward - looking statements within the meaning of Section 27A of the Securities Act of 1933, as amended (the “Securities Actˮ), and Section 21E of the Exchange Act. Forward - looking statements include, without limitation, statements regarding the financial position, financial performance, business strategy, expectations of our business and the plans and objectives of management for future operations. These statements constitute projections, forecasts and forward - looking statements, and are not guarantees of performance. Such statements can be identified by the fact that they do not relate strictly to historical or current facts. When used in this communication, forward - looking statements may be identified by the use of words such as “estimate,ˮ “plan,ˮ “project,ˮ “forecast,ˮ “intend,ˮ “will,ˮ “expect,ˮ “anticipate,ˮ “believe,ˮ “seek,ˮ “target,ˮ “designed toˮ or other similar expressions that predict or indicate future events or trends or that are not statements of historical facts. In addition, any statements that refer to projections, forecasts or other characterizations of future events or circumstances, including any underlying assumptions, are forward - looking statements. These forward - looking statements are based on information available as of the date of this communication and expectations, forecasts and assumptions as of that date and involve a number of judgments, risks and uncertainties. Accordingly, forward - looking statements should not be relied upon as representing our views as of any subsequent date and we do not undertake any obligation to update forward - looking statements to reflect events or circumstances after the date they were made, whether as a result of new information, future events or otherwise, except as may be required under applicable securities laws. You should not place undue reliance on forward - looking statements . As a result of a number of known and unknown risks and uncertainties, our actual results or performance may be materially different from those expressed or implied by our forward - looking statements . Some factors that could cause actual results to differ include, among others : ( 1 ) the outcome of any legal proceedings or government or regulatory action or inquiry that may be instituted against us or others ; ( 2 ) costs related to becoming a U . S . - listed public company that may be higher than currently anticipated ; ( 3 ) the possibility that we may be adversely affected by other economic, business and/or competitive factors ; ( 4 ) changes in business, market, financial, macro - economic political and/or regulatory conditions ; ( 5 ) volatility and rapid fluctuations in the market prices of digital assets, including cryptocurrencies and blockchain - related alternative investments, including those offered by or underlying those offered by, us ; ( 6 ) estimates of expenses and profitability ; ( 7 ) expectations with respect to future operating and financial performance and growth ; ( 8 ) our ability to execute on our business plans and strategy ; ( 9 ) failure to realize the anticipated benefits of the recent business combination, which may be affected by, among other things, competition, our ability to grow and manage growth profitably, build or maintain relationships with service providers and trading counterparties and retain management and key employees, capital expenditures, requirements for additional capital and timing of future cash flow provided by operating activities and the demand for digital assets, including cryptocurrencies and blockchain - related alternative investments, including those offered by or underlying those offered by, us ; ( 10 ) dilution in the future due to the exercise of a significant number of existing warrants and any future issuances of our equity securities ; ( 11 ) conflicts of interest that may arise from investment and transaction opportunities involving us and other investors and service providers or counterparties ; ( 12 ) the possibility that CoinShares may not be included in one or more securities indices, that the estimated demand for shares in connection with any such inclusion may not materialize or may differ materially from estimates presented herein, and that the proposed share repurchase program may not be approved by shareholders or, if approved, may not be implemented to the full extent authorized ; and ( 13 ) factors relating to our business, operations and financial performance, including : our ability to successfully implement our long - term business strategy ; the treatment of digital assets, including cryptocurrencies and blockchain - related alternative investments, including those offered by or underlying those offered by, us, for foreign and U . S . tax purposes ; digital asset trading venues may experience greater fraud, security failures or regulatory or operational problems than trading venues for more established asset classes ; risks relating to the custody of digital assets, including the loss or destruction of private keys required to access its digital assets and cyberattacks or other data loss relating to its digital assets, which could cause us and/or any of our product issuers, as applicable, to lose some or all of our or their digital assets ; a security breach, cyber - attack or other event where unauthorized parties obtain access to our digital assets and/or the digital assets of our product issuers, as a result of which we or they may lose some or all of our or their digital assets temporarily or permanently and our financial condition and results of operations could be materially adversely affected ; the emergence or growth of other digital assets, including those with significant private or public sector backing, including by governments, consortiums or financial institutions, could have a negative impact on the value of digital assets and adversely affect our business ; potential regulatory changes reclassifying certain digital assets as “securitiesˮ or “investment securitiesˮ under the Investment Company Act of 1940 , as amended (the “Investment Company Actˮ) or other federal securities laws could lead to our classification as an “investment companyˮ under the Investment Company Act and could adversely affect the market price of our digital assets and the market price of our listed securities ; and the other important factors discussed under the caption “Risk Factorsˮ in our Annual Report on Form 20 - F for the year ended December 31 , 2025 filed with the U . S . Securities and Exchange Commission (“SECˮ) and our other filings with the SEC as such factors may be updated from time to time .

Disclaimers — Non - GAAP Measures 3 Key Metrics and Other Information This presentation includes certain of our key metrics that our management uses to help evaluate our business, measure our performance, identify trends affecting our business, and make strategic decisions . Our key metrics are Assets Under Management (AUM), Revenue and Gains from Operations, Operating Income and Segment EBITDA . Definitions of our key metrics can be found in our Annual Report on Form 20 - F for the year ended December 31 , 2025 and our Report on Form 6 - K filed with the SEC on September 14 , 2026 . See “Non - GAAP Measuresˮ below for more information on non - GAAP financial measures . This presentation may contain metrics, data, estimates, and forecasts that are based on industry publications, third - party websites, or other publicly - available information, as well as other information based on our internal sources and calculations . This information involves many assumptions and limitations, including inherent challenges in measurement as our business and the markets in which we operate evolve . We have not independently verified the accuracy or completeness of the data contained in industry publications, third - party websites, and other publicly - available information . Accordingly, we make no representations as to the accuracy or completeness of that data nor do we undertake to update such data after the date of this presentation . Non - GAAP Measures We use certain financial measures not based on U . S . GAAP, including Revenue and gains from operations and Capital markets revenues and gains (together, the “Non - GAAP Measuresˮ), as well as key performance indicators and operating metrics, including Segment EBITDA and Assets Under Management (AUM) . Non - GAAP Measures are used by management, in addition to U . S . GAAP financial measures, to understand and compare our operating results across accounting periods, for risk management and operational decision - making . Non - GAAP Measures provide investors with additional information in evaluating the Companyʼs operating performance . These Non - GAAP financial measures have been prepared by, and are the responsibility of management, and have not been audited or reviewed by our independent registered public accounting firm . These Non - GAAP financial measurements should be considered in context with our U . S . GAAP results . The Non - GAAP Measures may not be comparable to similar measures disclosed by other companies, because not all companies and analysts calculate these measures in the same manner . We present the Non - GAAP Measures because we consider them to be important supplemental measures of our performance, and we believe they are frequently used by securities analysts, investors and other interested parties in the evaluation of companies in our sector . Management believes that investorsʼ understanding of our performance is enhanced by including the Non - GAAP Measures as a reasonable basis for comparing our ongoing results of operations . By providing the Non - GAAP Measures, together with reconciliations to U . S . GAAP, we believe we are enhancing investorsʼ understanding of our business and our results of operations, as well as assisting investors in evaluating how well we are executing our strategic initiatives . Items excluded from the Non - GAAP Measures are significant components in understanding and assessing financial performance . The Non - GAAP Measures have limitations as analytical tools and should not be considered in isolation, or as an alternative to, or a substitute for loss for the year, revenue or other financial statement data presented in our consolidated financial statements as indicators of financial performance . For definitions of our Non - GAAP Measures and reconciliation of the Non - GAAP Measures to the most directly comparable financial measure calculated and presented in accordance with U . S . GAAP, please see the “Reconciliation Tablesˮ at the end of this presentation, our Annual Report on Form 20 - F for the year ended December 31 , 2025 and our Report on Form 6 - K filed with the SEC on September 14 , 2026 .

CoinShares demonstrated significant resilience in 1H 2026 Six proof points from the biggest crypto contraction in history 4 01 CoinShares experienced net inflows $28M GROUP NET INFLOWS, 1Hʼ26 02 Flows better than key peers +6.2% NET FLOW OUTPERFORMANCE 03 Asset management product fee yields held stable $40M 1Hʼ26 ASSET MANAGEMENT FEES 04 Capital Markets earned through the storm $15M 1Hʼ26 CAPITAL MARKETS SEGMENT REVENUE & GAINS (1) 05 Maintained strong margins 39% 1Hʼ26 SEGMENT EBITDA MARGIN (2) 06 Recent recovery in digital assets; tracking towards Dec - 2025 levels +34% BITCOIN PRICE RECOVERY, 30 - JUN TO 31 - AUG 2026 Performance of the business coupled with balance sheet strength is driving the decision to seek approval for a stock repurchase plan — shareholders voting upon a buyback of up to 25% of shares outstandi ng (3) (1) Reflects the Capital Markets operating segment's total revenues and gains from operations as reported in Note 2 (Segment Reporting) to the Company's Unaudited Consolidated Interim Financial Statements . This measure excludes the XBT/ETP Pricing Differential, which is a non - cash, technical accounting adjustment, that is not related to the underlying performance of the business and obscures overall financial performance and comparability between periods . (2) Reflects “Segment EBITDAˮ per the companyʼs reported financials . See reconciliation tables for more details . (3) EGM scheduled for September 15 , 2026 , for shareholders to vote on the share repurchase plan . Proposal for a 5 - year share buyback program of up to 32 . 9 million shares (representing 25 % of the shares outstanding) at a minimum share price of $ 0 . 01 and maximum share price of $ 20 . 00 . Maximum per day share buybacks will not exceed 25 % of average daily trading volume (“ADTVˮ) (which using the 30 - day ADTV of 236 , 087 would be 59 , 022 shares per day as of September 2 , 2026 ) . CoinShares does not currently intend to purchase Ordinary Shares up to the full extent of this authority, and any purchases actually made, if any, will depend on blackout windows, safe harbor provisions, market conditions, the Companyʼs financial position, and other investment opportunities available to it at the relevant time . Positive net flows against a – $1.9bn market - price effect. Experienced 0.4% organic net inflows during 1H 2026 vs 5.8% average peer outflows. AM products fee yields held stable; total fees driven by AuM contraction in 1H. Deliberately conservative positioning of CM book through intentional and prudent risk management. Segment EBITDA of $21.6m with a solid margin in highly challenging period. Crypto prices have seen significant improvement since 1H 2026, AuM nearing year - end levels.

Fiscal half ended June 2026 — summary results 5 % change 1H 2026 1H 2025 Digital asset market performance (45%) $58,552 $107,174 BTC price (30 - Jun) CoinShares performance (31%) $5.5bn $8.0bn AUM (1) (33%) $40.0M $59.6M Asset Management revenue (44%) $14.9M $26.5M Capital Markets Segment Revenue & Gains (2) — — ($1.8M) Principal investments (63%) $21.6M $59.0M Segment EBITDA (3) — 39% 70% Segment EBITDA Margin (106%) ($5.1M) $75.9M Operating Income/(loss) COMMENTARY Ɣ Ɣ Ɣ Ɣ Ɣ ● Digital asset prices sharply contracted in the first half of 2026 , with both Bitcoin and Ethereum contracting more than 50 % by Q 2 2026 from recent highs experienced in early Q 4 2025 . CoinShares Asset Management proved its resilience through the downturn, being one of only two major players experiencing net inflows during the period, while the industry faced > 5 % net outflows . Capital Markets outperformed relative to the contraction in AuM, even though prudent risk management decisions during a period of significant market dislocation impacted results in the half . Segment EBITDA of $ 21 . 6 m, includes $ 4 . 9 million of one - time transaction related costs in 1 H 2026 . Excluding one - time transaction related costs, Segment EBITDA would be $ 26 . 5 million for 1 H 2026 ( 48 % Margin) . Operating income swung from a gain of $ 75 . 9 million in H 1 2025 to a loss of $ 5 . 1 million in H 1 2026 , driven principally by two items outside day - to - day operations : a $ 6 . 1 million share - based compensation charge on settlement of the Group's historic option scheme in connection with the Nasdaq listing, and a $ 34 . 7 million unfavourable swing in the XBT Pricing Differential, from an $ 18 . 1 million gain to a $ 16 . 6 million loss . Neither reflects the underlying performance of the business . Elected to repay 100 % of its long - term debt obligations in the half ( $ 28 . 3 million) and returned $ 21 . 5 million in cash to shareholders via the 2025 dividend paid in March 2026 (4) . (1) (2) (3) (4) Including $1.2bn seed AuM in 1H 2025 and $0.7bn seed AuM in 1H 2026. See footnote (1) on prior slide. Reflects “Segment EBITDA” per the company’s reported financials. See reconciliation tables for more details. Dividend paid in March 2026 and in advance of the closing of the U.S. Listing. CoinShares performance during the largest crypto contraction in history highlights the Companyʼs differentiation and uniquely attractive financial profile

CoinShares outperforms peers in the period Driving positive net Inflows in a period of significant volatility 6 KEY POINTS ● Peers experienced more than $ 7 billion of outflows, representing a blended 6 % net flow decline before material price declines . ● CoinShares was one of only two major players to record net positive flows in the period . ● CoinShares Physical continued its track record as the fastest - growing digital asset ETP in Europe . Note: includes competitors with greater than $250 million of starting - period digital asset ETP or ETF AuM. Source: Farside Investors daily flow data aggregated by calendar month.

Note(s): Data as of June 30, 2026. (1) CoinShares High Fee Generating Products Include: CoinShares XBT Provider, and CoinShares Physical (Excl. BITC). (2) CoinShares Access Products Include: CoinShares Physical (BITC), CoinShares US, and BLOCK Index. 7 CoinShares experienced net inflows - Decline in AuM driven by digital asset pricing AuM fell with crypto prices, not from client outflows: a digital asset recovery resets the book. (AuM increased by 25% in July and August as digital asset prices rebounded)

BLOCK Index significantly outperformed - driving a shift in product mix Correlation break: the AI re - rating of miners and digital infrastructure saw BLOCK outperform crypto by 50 – 60% 8 The CoinShares Blockchain Global Equity Index seeks to track the investment results ofi listed companies that participate in the blockchain or crypto ecosystem Largest Holdings: SBI Group, Samsung, Metaplanet, Riot Platforms 65bps Management Fee (Split With Invesco, 33bps to CoinShares)

Asset Management: product yields have held stable 9 We have not lost yield because of outflows, it is because a lower fee product (BLOCK Index) has seen significant outperformance – which is a net positive (e.g., more revenue), but optically skews group yield calculation Changes in group yield are driven by mix, with the core impact tied to BLOCK PRODUCT YIELD EVOLUTION, BPS (1) GROUP YIELD BRIDGE, BPS (2) Product yields held steady across both High Fee Generating Products (3) and Access Products (4) Note(s): Yield calculated as Quarterly Management Fee divided by Average of Three - Month End AuMs, Multiplied by Four. Yield calculated as Total Period Management Fee divided by the Average Monthly AuM in the period. CoinShares High Fee Generating Products Include: CoinShares XBT Provider, and CoinShares Physical (Excl. BITC). CoinShares Access Products Include: CoinShares Physical (BITC), CoinShares US, and BLOCK Index. Reflects the increase in the mix of the BLOCK Index relative to High Fee Generating Products. Reflects the increase in the mix of the CS Physical BITC and CoinShares US relative to High Fee Generating Products. Product Yield Changes are impacted by fluctuations in digital asset pricing over the course of a period (AuM is calculated as of the last day of each quarter, whereas revenue is recognized on a daily basis and AuM and other conditions can fluctuate significantly over the course of a quarter). Applies 1H2026 Average Fee Yields to Average 2025 AuM Weights.

Capital Markets: $14.9M Segment Revenue & Gains Earned With a Conservative Book Deliberately conservative positioning through extreme volatility 10 Commentary YTD Jun 2026 YTD Jun 2025 $ in thousands ● Decrease in line with the reduction in staked asset prices during the period (predominantly ETH). ● Staking revenue is down 33% compared to 37% ETH decline, with reversion expected if ETH were to increase. $6,642 $9,823 Staking revenue ● Heightened risk management in a period of extreme volatility — reduced lending activity to manage risk. ● Management expects lending book to revert to prior levels in stable or recovering digital asset environments. 2,432 4,927 Lending book interest ● Continued strong performance, albeit impacted by digital asset pricing contraction with reduction in general trading activities consistent with broader Capital Markets activities 7,567 11,743 Other Revenue & Trading Gains ● Losses incurred on digital asset fund positions (fund positions not present in YTD June 2025). (1,779) - Fund Losses $14,861 $26,493 Total Contraction due to prudent risk management during a period of significant market dislocation: Capital Markets is structured to do well in underperforming crypto markets and exceptionally well in strong crypto markets.

OpEx investments associated with the U.S. listing are behind us Significant Spend has Been One - Time In Nature 11 $25.6M 1H 2026 OpEx (1) −$4.9M One - time go - public costs $20.7M Illustrative pro forma OpEx of present underlying business $41.3M Illustrative annualised OpEx of present underlying business OPERATING EXPENSE RUN - RATE BRIDGE, $M COST SCHEDULE & COMMENTARY 1H 2026 OpEx elevated due to one - time requirements of US listing process Commentary $M Item Elevated accounting advisor spend related to PCAOB uplift and GAAP conversion covering multiple audit periods. $2.5 Extra professional fees Incremental audit requirements to facilitate the US listing and GAAP conversion (multiple years of audits completed in one period) $1.2 Multi - period audit spend Increased marketing spend in lead - up to US Listing. $1.1 Transaction marketing Other costs related to US Listing. $0.2 Other costs $4.9 One - time go - public costs (1) OpEx excludes share - based compensation, D&A and exceptional expenses.

Illustrative Scenarios for Recovery of Digital Asset Prices Illustrative only — not guidance, a forecast, projection or estimate of future performance Illustrative AUM (1) Illustrative Revenue & Gains Note(s): This analysis is provided solely for illustrative purposes to help synthesize the information presented on the preceding slides and demonstrate the potential impact of the unique factors affecting the period. It does not constitute guidance, a forecast, projection, prediction, or estimate of 12 future performance. Actual results may differ materially from those illustrated, even if the digital asset pricing assumptions shown are realized. Annualized does not suggest full year 2026 performance, rather illustrative 12 months performance given prices as at June 30, 2026. (1) AuM methodology maintains flow impact experienced on each product through June 30, 2026 and then reverses the percentage price im pac t experienced since the period referenced. (2) CoinShares High Fee Generating Products Include: CoinShares XBT Provider, and CoinShares Physical (Excl. BITC) | CoinShares Access Products Include: CoinShares Physical (BITC), CoinShares US, and BLOCK Index. (3) Leverages the AuMs implied by the methodology in footnote 1 and applies the current average fee yield as of 6/30/2026 to each product. (4) For Staking Revenue, Lending Book Interest, Other Revenue, and Trading Gains / (Losses) utilizes the average price impact experienced across the High Fee Products (as a proxy for digital asset pricing) since the period referenced and divides current annualized capital markets revenue by one plus the experienced price decline to revert the pricing impact. Excludes any gain/loss on movement in the XBT Pricing Differential High - fee AuM increases 73 – 100% versus Access product AuM growth of 11 – 16%. Higher portion of high - fee AuM as well as normalization of lending and staking activity in Capital Markets drives recovery

Recent Recovery in Digital Assets Post 1H2026 Significant Recovery Occurred Late in August 2026 (1) ● July - August price appreciation is the primary driver of AuM rebuilding with flows providing incremental support ● High Fee products are more sensitive to crypto market recovery which drives favorable mix expansion ● As of August 31, 2026, CoinShares is 20% below December 2025 pricing 13 Note(s): Data as of August 31, 2026. CoinShares High Fee Generating Products Include: CoinShares XBT Provider, and CoinShares Physical (Excl. BITC) | CoinShares Access Products Include: CoinShares Physical (BITC), CoinShares US, and BLOCK Index. Given the recovery occurred in late August 2026, its impact is expected to be limited for Q3 2026 and full - year 2026 and is expected to be more impactful in 2027 assuming digital asset pricing maintain these levels.

Net available capital bridge CoinShares repaid 100% of its long - term borrowings in 1H 2026 and continued to generate operating cash flow BRIDGE ITEMS 15 CoinShares has a robust capital position, further strengthened by the repayment of all existing indebtedness — resulting in a net available capital position of over $410 million. (1) Reflects Available Capital less total indebtedness. Dec 2025 Available Capital of $481.4 million bridges to Jun 2026 Available Capital when including the $28.3 million repayment of the Reyl loan, which was repaid during H1. Commentary Impact Item Net of investment banking and legal fees, the US listing generated $3.9M of net proceeds $3.9 US Listing CoinShares generated $22.3M from operations $22.3 Operating Reflects payment of 2025 dividend in March 2026 ($21.5) Dividend Impact on CoinShares treasury by digital asset pricing contraction ($15.4) Digital Asset Treasury Fair value gap between the Group's XBT certificate liabilities and the digital assets held to hedge them narrowed (unrealized) ($16.6) XBT Pricing Diff. Reflects payments made in 2026 for bonuses accrued in 2025 ($4.3) Out of Period Bonuses Paid Interest payments made on broker balance drawdowns in H1 2026 ($4.2) Net Finance Costs Reflects payments made to Bastion prior to close, capitalized expenses and other working capital changes ($3.3) Other
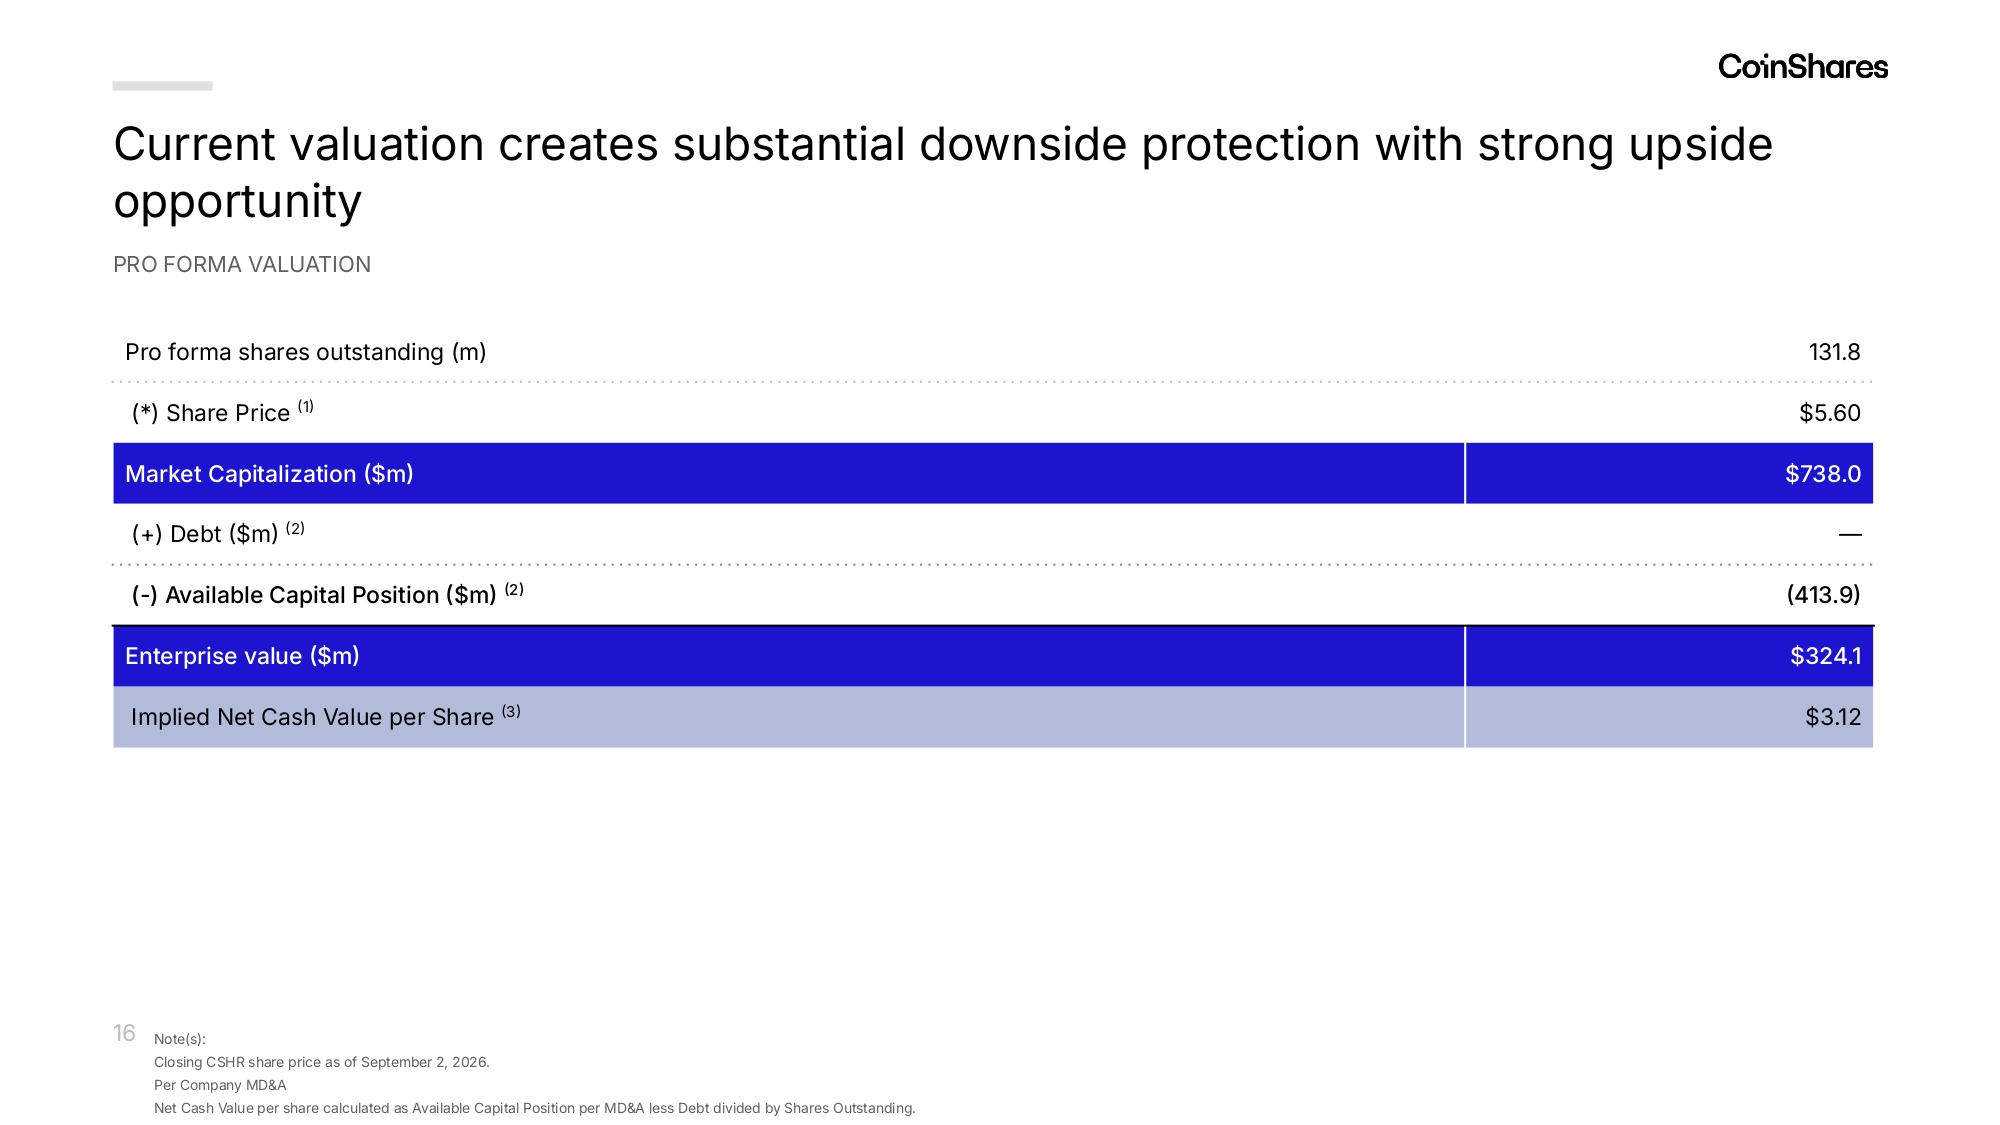
Current valuation creates substantial downside protection with strong upside opportunity 16 PRO FORMA VALUATION 131.8 Pro forma shares outstanding (m) $5.60 (*) Share Price (1) $738.0 Market Capitalization ($m) — (+) Debt ($m) (2) (413.9) ( - ) Available Capital Position ($m) (2) $324.1 Enterprise value ($m) $3.12 Implied Net Cash Value per Share (3) Note(s): Closing CSHR share price as of September 2, 2026. Per Company MD&A Net Cash Value per share calculated as Available Capital Position per MD&A less Debt divided by Shares Outstanding.
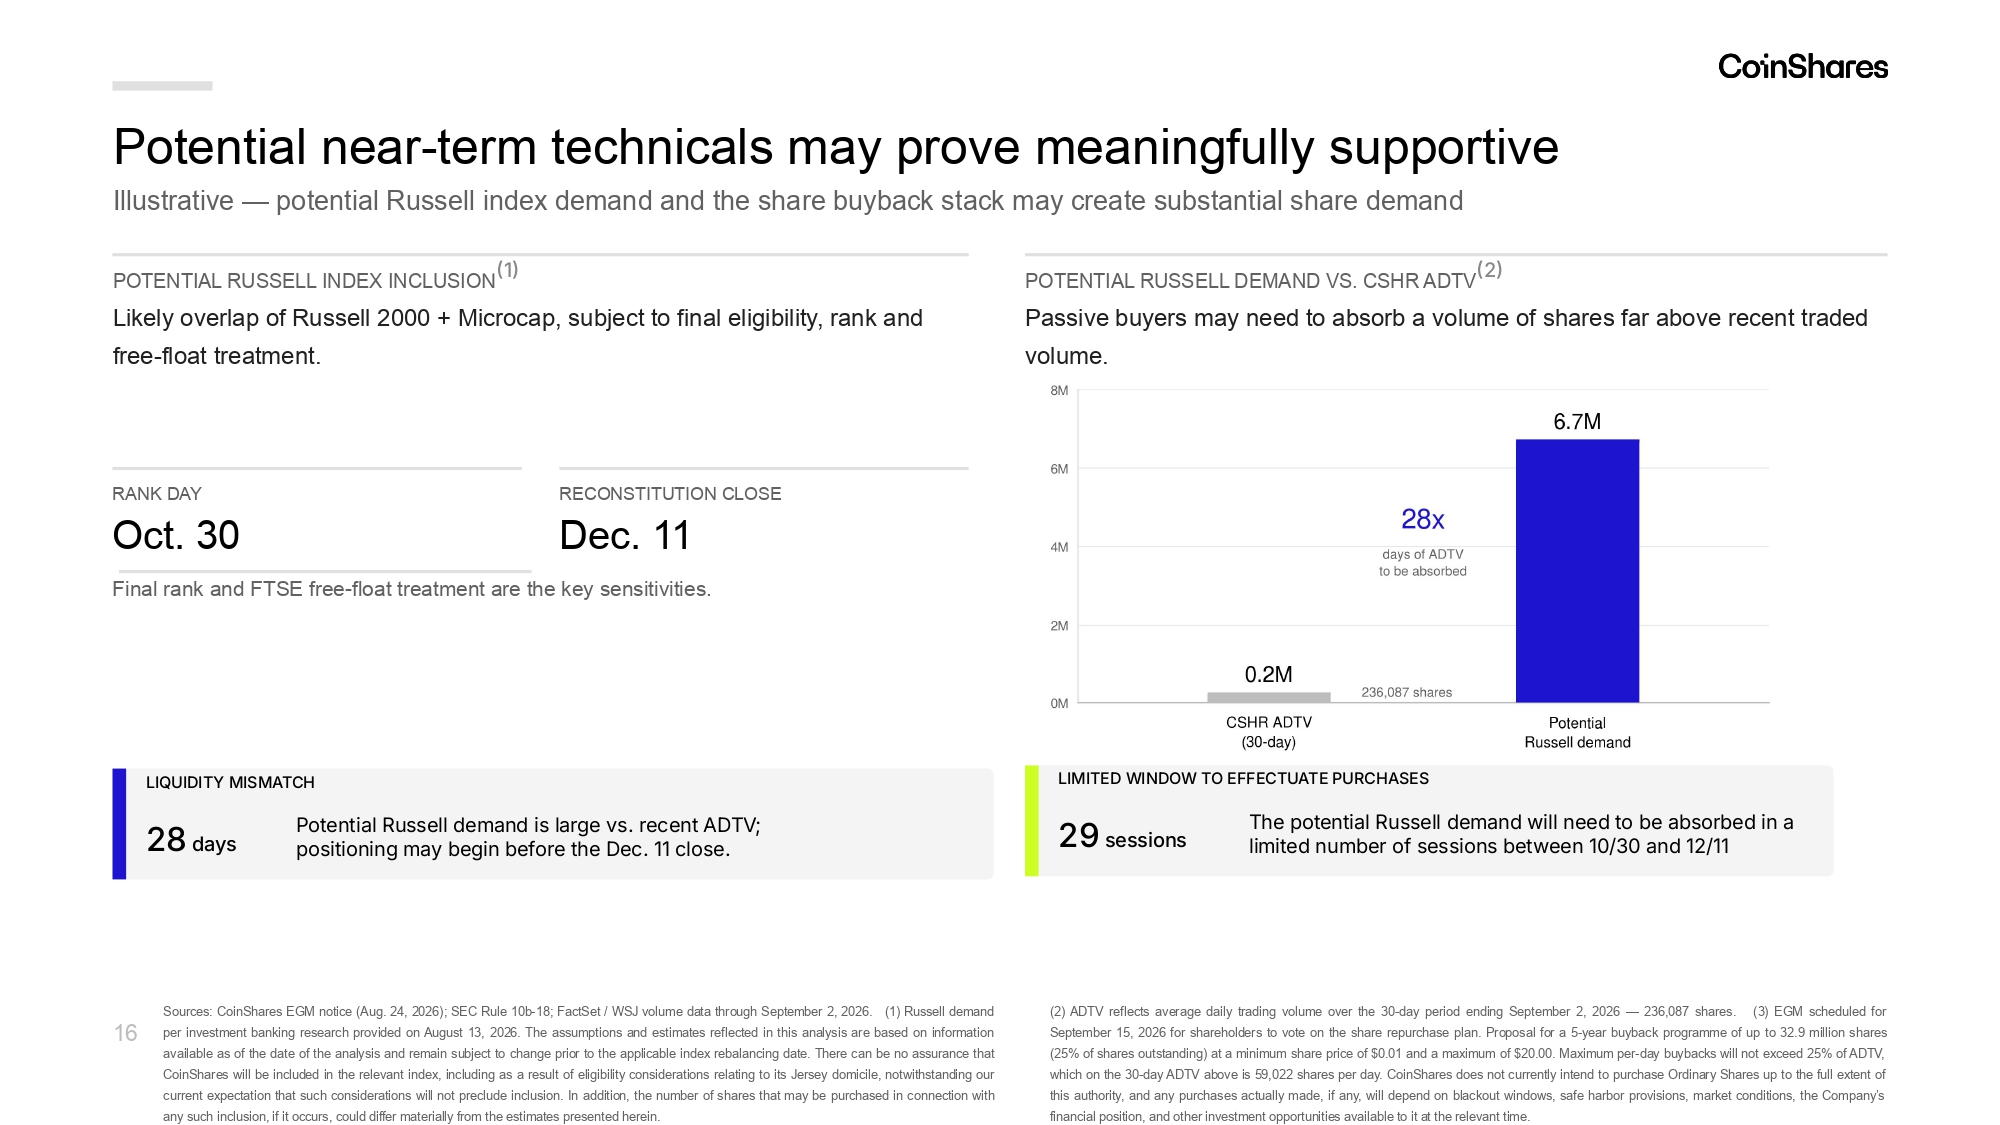
Potential near - term technicals may prove meaningfully supportive Illustrative — potential Russell index demand and the share buyback stack may create substantial share demand 16 POTENTIAL RUSSELL INDEX INCLUSIO N (1) Likely overlap of Russell 2000 + Microcap, subject to final eligibility, rank and free - float treatment. RANK DAY Oct. 30 RECONSTITUTION CLOSE Dec. 11 Final rank and FTSE free - float treatment are the key sensitivities. POTENTIAL RUSSELL DEMAND VS. CSHR ADTV (2) Passive buyers may need to absorb a volume of shares far above recent traded volume. Sources : CoinShares EGM notice (Aug . 24 , 2026 ) ; SEC Rule 10 b - 18 ; FactSet / WSJ volume data through September 2 , 2026 . ( 1 ) Russell demand per investment banking research provided on August 13 , 2026 . The assumptions and estimates reflected in this analysis are based on information available as of the date of the analysis and remain subject to change prior to the applicable index rebalancing date . There can be no assurance that CoinShares will be included in the relevant index, including as a result of eligibility considerations relating to its Jersey domicile, notwithstanding our current expectation that such considerations will not preclude inclusion . In addition, the number of shares that may be purchased in connection with any such inclusion, if it occurs, could differ materially from the estimates presented herein . ( 2 ) ADTV reflects average daily trading volume over the 30 - day period ending September 2 , 2026 — 236 , 087 shares . ( 3 ) EGM scheduled for September 15 , 2026 for shareholders to vote on the share repurchase plan . Proposal for a 5 - year buyback programme of up to 32 . 9 million shares ( 25 % of shares outstanding) at a minimum share price of $ 0 . 01 and a maximum of $ 20 . 00 . Maximum per - day buybacks will not exceed 25 % of ADTV, which on the 30 - day ADTV above is 59 , 022 shares per day . CoinShares does not currently intend to purchase Ordinary Shares up to the full extent of this authority, and any purchases actually made, if any, will depend on blackout windows, safe harbor provisions, market conditions, the Company’s financial position, and other investment opportunities available to it at the relevant time . LIQUIDITY MISMATCH 28 days Potential Russell demand is large vs. recent ADTV; positioning may begin before the Dec. 11 close. 29 sessions LIMITED WINDOW TO EFFECTUATE PURCHASES The potential Russell demand will need to be absorbed in a limited number of sessions between 10/30 and 12/11

Appendix & Reconciliation Tables

18 Reconciliation Tables Revenue & Gains from Operations 2025 Period Ended June 30, 2026 2023 Year Ended December 31, 2025 2024 (:'OOO) 79,950 51,438 87,711 155,540 165,677 Revenue (179,106) (1,877,339) 1,744,803 2,933,410 (982,773) (Loss)/gain on digital assets and digital asset ETPs 86,169 1,754,778 (1,703,465) (2,910,985) 802,746 (Loss)/gain on certificate liabilities 115,403 109,430 (28,366) 19,835 211,999 Other operating gains/(losses) 102,416 38,307 100,683 197,800 197,649 Revenue and gains from operations Operating Income to Segment EBITDA 2025 Period Ended June 30, 2026 2023 Year Ended December 31, 2025 2024 (:'OOO) 75,908 (5,112) 61,273 125,011 126,990 Operating Income (171) 6,089 1,261 12,369 2,839 Share based compensation (18,122) 16,556 (2,234) (15,760) (1,633) XBT pricing differential 1,409 2,164 3,993 3,022 3,143 Depreciation and amortization - 1,941 - - - Non - recurring expenses 59,024 21,638 64,293 124,642 131,339 Segment EBITDA

19 CapiЧal Mar½cЧs Rcvcnuc and Gains / ScgmcnЧ Rcvcnuc and Gains 2025 Period Ended June 30, 2026 2023 Year Ended December 31, 2025 2024 (:'OOO) 9,823 6,642 24,692 29,449 21,901 Staking revenue 4,927 2,432 2,390 9,397 10,684 Lending book interest 5,587 2,362 6,920 5,003 6,721 Other revenue 20,337 11,436 34,002 43,849 39,306 Capital Markets revenue (179,106) (1,877,339) 1,744,803 2,933,410 (982,773) (Loss)/gain on digital assets 86,169 1,754,778 (1,703,465) (2,910,985) 802,746 Gain/(loss) on certificate liabilities 115,403 109,430 (28,366) 19,835 211,999 Other operating gains/(losses) 1,812 - (3,452) (3,427) 1,813 Less: unallocated gains/(losses) on digital assets 24,278 (13,131) 9,520 38,833 33,785 Capital Markets gains/(losses) 44,615 (1,695) 43,522 82,682 73,091 Capital Markets revenue and gains 18,122 (16,556) 2,234 15,760 1,633 Less: XBT pricing differential 26,493 14,861 41,288 66,922 71,458 Capital Markets Segment revenue and gains Reconciliation Tables
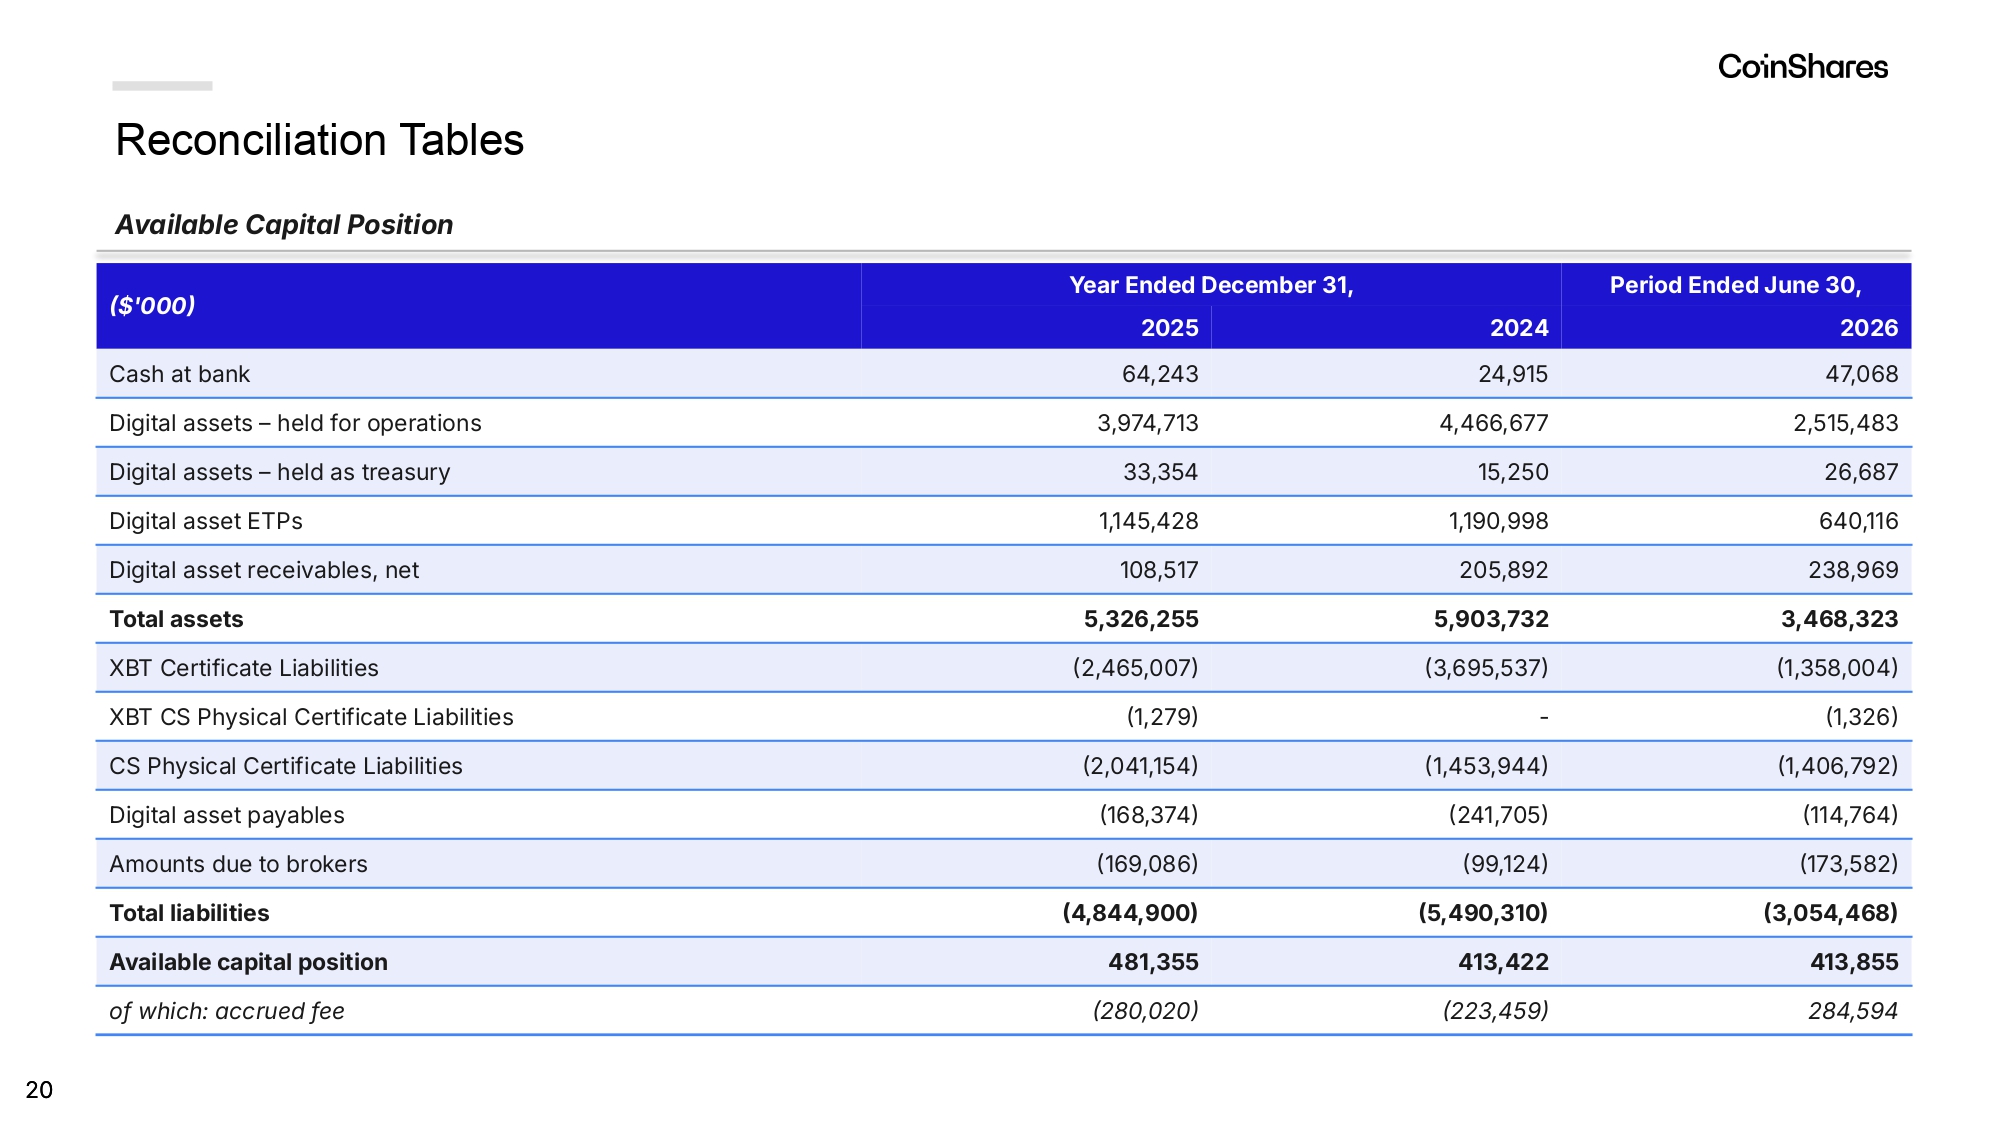
20 Availablc CapiЧal PosiЧion Period Ended June 30, 2026 2024 Year Ended December 31, 2025 (:'OOO) 47,068 24,915 64,243 Cash at bank 2,515,483 4,466,677 3,974,713 Digital assets – held for operations 26,687 15,250 33,354 Digital assets – held as treasury 640,116 1,190,998 1,145,428 Digital asset ETPs 238,969 205,892 108,517 Digital asset receivables, net 3,468,323 5,903,732 5,326,255 Total assets (1,358,004) (3,695,537) (2,465,007) XBT Certificate Liabilities (1,326) - (1,279) XBT CS Physical Certificate Liabilities (1,406,792) (1,453,944) (2,041,154) CS Physical Certificate Liabilities (114,764) (241,705) (168,374) Digital asset payables (173,582) (99,124) (169,086) Amounts due to brokers (3,054,468) (5,490,310) (4,844,900) Total liabilities 413,855 413,422 481,355 Available capital position 284,594 (223,459) (280,020) ofi which: accrued fiee Reconciliation Tables