Exhibit 99.1
| Q2 2026 Investor Presentation |

| Legal Disclaimer Cautionary Statement Regarding Forward-Looking Statements This presentation, including any oral statements made regarding the contents of this presentation, contains certain statements that are not historical facts that may constitute forward-looking statements within the meaning of Section 27A of the Securities Act of 1933, as amended, and Section 21E of the Securities Exchange Act of 1934, as amended, and are intended to be covered by the safe harbor provisions of the Private Securities Litigation Reform Act of 1995. When used in this presentation the words “believe,” “anticipate,” “expect,” “may,” “will,” “assume,” “should,” “predict,” “could,” “would,” “intend,” “targets,” “estimates,” “projects,” “plans,” and “potential,” and other similar words and expressions of the future, are intended to identify such forward-looking statements, but other statements not based on historical information may also be considered forward-looking, including statements about Bar Harbor Bankshares’ (the “Company”) future financial and operating results and the Company’s plans, objectives, and intentions. All forward-looking statements are subject to risks, uncertainties, and other factors that may cause the actual results, performance, or achievements of the Company to differ materially from any results, performance, or achievements expressed or implied by such forward-looking statements. These forward-looking statements are subject to known and unknown risks, uncertainties and other factors that could cause the actual results to differ materially from the statements, including, but not limited to: (1) deterioration in the financial performance and/or condition of borrowers of Bar Harbor Bank & Trust (the “Bank” or “BHBT”), including as a result of the negative impact of inflationary pressures on our customers and their businesses resulting in significant increases in credit losses and provisions for those losses; (2) the possibility that our asset quality could decline or that we experience greater loan losses than anticipated; (3) increased levels of other real estate owned, primarily as a result of foreclosures; (4) the impact of liquidity needs on our results of operations and financial condition; (5) competition from financial institutions and other financial service providers; (6) the effect of interest rate increases on the cost of deposits; (7) unanticipated weakness in loan demand or loan pricing; (8) adverse conditions in the national or local economies including in our markets throughout Northern New England; (9) changes in consumer spending, borrowing and saving habits; (10) the emergence and effects related to a future pandemic, epidemic or outbreak of an infectious disease, including actions taken by governmental officials to curb the spread of such an infectious disease, and the resulting impact on general economic and financial market conditions and on the Company’s and our customers' business, results of operations, asset quality and financial condition; (11) the effects of civil unrest, international hostilities or other geopolitical events, including the war in Ukraine and recent hostilities in the Middle East; (12) failure to realize the expected synergies, cost savings and other financial benefits from the acquisition of Guaranty Bancorp, Inc., the parent company of Woodsville Guaranty Savings Bank ("Woodsville"); (13) lack of strategic growth opportunities or our failure to execute on available opportunities; (14) the ability to grow and retain low-cost core deposits and retain large, uninsured deposits; (15) our ability to effectively manage problem credits; (16) our ability to successfully implement efficiency initiatives on time and with the results projected; (17) our ability to successfully develop and market new products and implement technology effectively; (18) the impact of negative developments in the financial industry and United States and global capital and credit markets; (19) our ability to retain executive officers and key employees and their customer and community relationships; (20) our ability to adapt to technological changes; (21) risks associated with litigation, including reputational and financial risks and the applicability of insurance coverage; (22) the vulnerability of the Bank’s computer and information technology systems and networks, and the systems and networks of third parties with whom the Company or the Bank contract, to unauthorized access, computer viruses, phishing schemes, spam attacks, human error, natural disasters, power loss, and other security breaches and interruptions; (23) changes in the reliability of our vendors, internal control systems or information systems; (24) ongoing competition in the labor markets and increased employee turnover; (25) the potential impact of climate change; (26) our ability to comply with various governmental and regulatory requirements applicable to financial institutions; (27) changes in state and federal laws, rules, regulations, or policies applicable to banks or bank or financial holding companies, including regulatory or legislative developments; (28) the effects of and changes in trade and monetary and fiscal policies and laws, including the interest rate policies of the Board of Governors of the Federal Reserve System; (29) adverse impacts (including costs, fines, reputational harm, or other negative effects) from current or future litigation, regulatory examinations, or other legal and/or regulatory actions; (30) reductions in the market value or outflows of wealth management assets under management; (31) the impacts of tariffs, sanctions and other trade policies of the United States and its global trading counterparts; and (32) general competitive, economic, political, and market conditions, including economic conditions in the local markets where we operate. Other factors not identified above, including those described under the headings “Risk Factors” and “Management’s Discussion and Analysis of Financial Condition and Results of Operations,” in our Annual Report on Form 10-K for the fiscal year ended December 31, 2025, our Quarterly Reports on Form 10-Q, and Current Reports on Form 8-K filed with the Securities and Exchange Commission (the “SEC”) and available on the SEC’s website at http://www.sec.gov, may also cause actual results to differ materially from those described in our forward-looking statements. Most of these factors are difficult to anticipate and are generally beyond our control. Given these uncertainties, you are cautioned not to place undue reliance on such forward-looking statements, and you should consider these factors in connection with considering any forward-looking statements that may be made by us. We undertake no obligation to release publicly any revisions to any forward-looking statements, to report events or to report the occurrence of unanticipated events unless we are required to do so by law. 2 |

| Legal Disclaimer Non-GAAP Financial Measures This presentation contains certain non-GAAP financial measures in addition to results presented in accordance with accounting principles generally accepted in the United States of America (“GAAP”). These non-GAAP measures are intended to provide the reader with additional supplemental perspectives on operating results, performance trends, and financial condition. Non-GAAP financial measures are not a substitute for GAAP measures; they should be read and used in conjunction with the Company's GAAP financial information. Because non-GAAP financial measures presented in this document are not measurements determined in accordance with GAAP and are susceptible to varying calculations, these non-GAAP financial measures, as presented, may not be comparable to other similarly titled measures presented by other companies. A reconciliation of non-GAAP financial measures to GAAP measures is provided below. In all cases, it should be understood that non-GAAP measures do not depict amounts that accrue directly to the benefit of shareholders. An item which management excludes when computing non-GAAP core earnings can be of substantial importance to the Company's results for any particular quarter or year. Each non-GAAP measure used by the Company in this report as supplemental financial data should be considered in conjunction with the Company's GAAP financial information. The Company utilizes the non-GAAP measure of core earnings in evaluating operating trends, including components for core revenue and expense. These measures exclude amounts which the Company views as unrelated to its normalized operations, including gains/losses on securities, premises, equipment and other real estate owned, acquisition costs, restructuring costs, legal settlements, and systems conversion costs. Non-GAAP adjustments are presented net of an adjustment for income tax expense. The Company also calculates core earnings per share based on its measure of core earnings. The Company views these amounts as important to understanding its operating trends, particularly due to the impact of accounting standards related to acquisition activity. Analysts also rely on these measures in estimating and evaluating the Company's performance. Management also believes that the computation of non-GAAP core earnings and core earnings per share may facilitate the comparison of the Company to other companies in the financial services industry. The Company also adjusts certain equity related measures to exclude intangible assets due to the importance of these measures to the investment community. Please refer to the Appendix for more information about the non-GAAP financial measures, and reconciliations of the non-GAAP financial measures to their most directly comparable GAAP financial measures. 3 |

| BHB (60 full-service branches) Assets Deposits Gross Loans ROAA Net Interest Margin¹ $4.7B $3.9B $3.6B 1.31% 3.61% ¹ For a reconciliation of non-GAAP measures to comparable GAAP measures, see the Appendix ² Data as of September 17, 2026 Bar Harbor Bankshares at a Glance ME VT NH Augusta Montpelier Concord Bar Harbor Eastport Rutland 4 Efficiency Ratio¹ Assets Under Management Market Capitalization² 55.8% $3.5B $672M Dividend Yield² 3.4% Financial Highlights for the Quarter Ended 6/30/2026 NYSEAM: BHB |

| Investment Highlights 5 Experienced management team with extensive market knowledge and a commitment to risk management History of consistent profitability, targeted organic growth, and opportunistic M&A Scarcity value as one of the few publicly traded New England financial institutions Profitability strengthened by diversified sources of fee income representing 22% of net revenue¹ Disciplined credit culture with an adherence to strong underwriting Service and sales-driven culture with a focus on core commercial business growth ¹ For the 12 months ending 6/30/26, includes wealth, treasury, customer derivatives and mortgage services |

| Bar Harbor Bankshares Operating Philosophy 6 We set out to build a balanced Bank that is not overly reliant on any one business, with a strong risk-focused culture, and a judicious approach to capital management through all market conditions. Growing market share as high-touch, solutions-based service differentiates us from competitors Focusing on core earnings while balancing growth with profitability Growing core transactional deposits over the long term Adhering to disciplined credit culture with historic low charge-off rates Diligently managing interest rate sensitivity, leveraging expansive in-house modeling capacity Expanding non-interest income as a percentage of total revenue Managing non-interest expenses while selectively investing in infrastructure, digital platforms, call center, technology and operations Selective and cohesive acquisitions to supplement organic growth (three since 2017) |

| A Proven Senior Executive Team Curtis C. Simard • Joined as President & CEO of Bar Harbor Bank & Trust in June of 2013 • Served as Managing Director of Corporate Banking for TD Bank • Over 30+ years of industry experience SVP, Chief Human Resources Officer Alison DiPaola • Joined in June 2013 • Extensive human resources experience including being SHRM-SCP certified • Over 10+ years of industry experience Jason Edgar President, Bar Harbor Wealth Management • Joined in June of 2019 • Served as SVP, Director of Wealth Management at Berkshire Hills Bancorp and has over 20+ years industry experience Marion Colombo EVP, Director of Retail Delivery • Joined in February of 2018 • Over 30+ years of experience, including Market President of Retail for TD Bank in Boston John Mercier EVP, Chief Lending Officer • Joined in April of 2017 • Over 30+ years of experience in lending throughout the Northeast John Williams SVP, Chief Risk Officer • Joined in December of 2014 • 10+ years in various risk management roles within banking Joseph Scully SVP, Chief Information Officer & Director of Operations • Joined in January of 2015 • Over 30+ years of experience in operations, technology & security experience, including the Department of Defense and Financial Institutions 7 EVP, Chief Financial Officer & Treasurer Josephine Iannelli • Joined in October of 2016 • Served as EVP CFO and Treasurer of Berkshire Hills Bancorp as well as other various management positions at PNC • Over 30+ years of industry experience President & Chief Executive Officer |

| Scarcity Value in High-Quality Markets Community Bank Deposit Market Share by State¹ Attractive Markets of Operation² Deposits Market Rank Company Branches ($M) Share (%) Maine 1 Bangor Bancorp MHC 62 5,578 16.4 2 Camden National Corp. 56 4,549 13.4 3 Northeast Bank 9 3,406 10.0 4 The First Bancorp Inc. 18 2,706 7.9 5 Machias Bancorp MHC 15 2,294 6.7 6 Maine Community Bancorp MHC 23 2,253 6.6 7 Bar Harbor Bankshares 22 1,940 5.7 8 Norway Bancorp MHC 24 1,589 4.7 9 Mascoma Mutual Financial Services 11 1,373 4.0 10 Kennebec Savings MHC 8 1,353 4.0 New Hampshire 1 New Hampshire Mutual Bancorp 31 3,162 15.8 2 BNH Financial 21 2,262 11.3 3 Mascoma Mutual Financial Services 13 1,583 7.9 4 Bar Harbor Bankshares 29 1,505 7.5 5 Bank of New England 6 1,351 6.8 6 Independent Bank Corp. 8 1,018 5.1 7 Camden National Corp. 16 997 5.0 8 Eastern Bankshares Inc. 9 831 4.2 9 Franklin Bancorp MHC 9 747 3.7 10 Ledyard Financial Group Inc. 10 721 3.6 Vermont 1 Community Financial System Inc. 29 1,465 15.9 2 Northfield Mutual Holding Co. 13 1,281 13.9 3 Mascoma Mutual Financial Services 14 991 10.7 4 Union Bankshares Inc. 14 942 10.2 5 Community Bancorp. 12 934 10.1 6 Middlebury National Corp. 7 506 5.5 7 Passumpsic Bancorp 8 485 5.3 8 Community Financial MHC 5 477 5.2 9 Bar Harbor Bankshares 11 381 4.1 10 Beacon Financial Corp. 5 367 4.0 1 Reflects deposit market share among banks with total assets less than $100 billion 2 Includes branches in MSAs unless otherwise indicated; Deposit totals as of June 30, 2025 Lebanon-Claremont, NH-VT Concord, NH Manchester-Nashua, NH $1.1B Total Deposits 25 Total Branches $317M Total Deposits 5 Total Branches $248M Total Deposits 6 Total Branches Key Employers: Key Employers: Key Employers: 8 Hancock, ME (County) $1.5B Total Deposits 8 Total Branches Key Employers: |

| Q2 2026 Financial Highlights 9 1 For a reconciliation of non-GAAP measures to comparable GAAP measures, see the Appendix 2 Annualized metric used to account for seasonality. 3 CRE/ Risk-Based Capital defined as commercial real estate loans as outlined in the regulatory agencies guidance on commercial real estate (CRE) as a percent of risk-based capital. Excludes owner-occupied. MRQ ROAA (annualized) 1.31% Core ROAA (annualized) ¹ 1.33% ROATCE (annualized) ¹ 16.11% Core ROATCE (annualized) ¹ 16.31% Net Interest Margin¹ 3.61% Efficiency Ratio¹ 55.8% Annualized Loans HFI Growth 3.2% Annualized YTD Deposit Growth2 2.0% NIB Deposits ($M) $678 NIB Deposits (%) 17% Non-Performing Assets / Total Assets 0.44% NCOs / Avg. Loans (annualized) 0.38% TCE / TA¹ 8.56% CET1 Ratio 11.45% CRE Ratio3 335% Profitability BS Growth Credit Capital |

| Loans – Focus on Profitability 10 Loan Mix by Product¹ 1 Commercial loans include construction, commercial real estate, municipal, and commercial and industrial loans. Consumer loans include home equity and other consumer loans. 57% 61% 64% 67% 69% 71% 69% 39% 35% 32% 30% 28% 25% 27% 4% 4% 4% 3% 3% 4% 4% $2.6B $2.5B $2.9B $3.0B $3.1B $3.6B $3.6B 2020 2021 2022 2023 2024 2025 Q2 2026 Total Commercial Residential Real Estate Consumer • In Q2 2026, yield on loans was 5.52% • Continuing to prudently evaluate loan portfolio mix and strategy • Prioritizing profitable growth with a conservative credit culture • Evolving portfolio mix reflects strategic shift toward commercial lending Highlights Commercial Loan Mix (Q2 2026) OO CRE 15% Construction 10% Non-OO CRE 60% C&I 15% $2.4B Total |

| Asset Quality 11 0.92% 0.95% 0.94% 0.96% 0.89% 2025Q2 2025Q3 2025Q4 2026Q1 2026Q2 0.31% 0.27% 0.32% 0.65% 0.32% 2025Q2 2025Q3 2025Q4 2026Q1 2026Q2 0.30% 0.25% 0.29% 0.52% 0.44% 2025Q2 2025Q3 2025Q4 2026Q1 2026Q2 0.03% 0.04% 0.03% 0.00% 0.38% 2025Q2 2025Q3 2025Q4 2026Q1 2026Q2 NCOs / Avg. Loans Non-Performing Loans as a % of Total Loans Allowance for Credit Losses as a % of Total Loans (period end) NPAs as a % of Total Assets |

| Strong Credit-Oriented Culture Supporting Our Growth • Loans 30 days past due at 6/30/2026 were 0.28% of total loans, compared to 0.55% at 3/31/2026 and 0.27% at 6/30/2025. • Non-accruing loans ended the quarter at 0.32% of total loans, which was down from 0.65% for Q1 2026. • Net charge-offs totaled $3.4 million YTD, driven by a $3.3 million partial charge-off in Q2 related to a previously non-accruing relationship that was moved into other real estate owned and that carried significant specific reserves at the end of Q1. • Pass-rated loans ratio of 95.35% (up from 94.6% at 3/31/2026), with positive external feedback from independent Loan Review 12 Delinquent & Non-performing Loans / Total Loans1 1 As of 9/30/2025, WGSB loan data remained outside BHBT’s core system and had not yet been fully integrated into reporting. Accordingly, Q2 2025 and Q3 2025 figures reflect BHBT standalone. WGSB figures are included beginning in Q4 2025. 2 The increase for Q4 2025 and Q1 2026 was primarily a function of timing given the 31st day lands on a business day and a group of customers typically make payments about 30 days in arrears which become reportable as overdue. Accordingly, we do not believe the increase was an indication of deteriorated credit quality. Q2 2025 Q3 2025 Q4 2025 Q1 2026 Q2 2026 Accruing Delinquent Loans² 0.09% 0.09% 0.27% 0.32% 0.12% Non-Accruing Loans 0.31% 0.27% 0.32% 0.65% 0.32% Total Delinquent and Non-Accruing Loans 0.40% 0.36% 0.59% 0.97% 0.44% |

| Deposits – Consistent Funding Source 13 Historical Deposit Mix Highlights Deposit Mix by Product (Q2 2026) 76% 86% 89% 78% 75% 76% 76% 24% 14% 11% 22% 25% 24% 24% $2.9B $3.0B $3.0B $3.1B $3.3B $3.8B $3.9B 2020 2021 2022 2023 2024 2025 Q2 2026 Total non-maturity deposits Time Non-interest bearing demand 17% Interest-bearing demand 30% Savings 16% Money market 13% Time deposits 24% $3.9B Total • In Q2 2026, cost of deposits was 1.55% • Stable deposit trends supported by a strong branch sourcing network • Consistent core funding for balance sheet growth • Ample contingent liquidity available¹ 1 As of June 30, 2026, available same-day liquidity totaled approximately $1.3 billion, including cash, borrowing capacity at FHLB and the Federal Reserve Discount Window and various lines of credit. Additional sources of liquidity include cash flows from operations, wholesale deposits, cash flow from our amortizing securities and loan portfolios. As of June 30, 2026, we had unused borrowing capacity at the FHLB of $521.9 million, unused borrowing capacity at the Reserve Bank of $105.6 million and unused lines of credit totaling $41.0 million, in addition to $104.4 million in cash. |

| Diversification of Non-Interest Income 14 Note: Non-interest income composition and percentage of operating revenue excludes one-time items such as the gain (loss) on available-for-sale debt securities • We have diverse sources of non-interest income that continue to be a significant contribution in any rate environment • Mortgage production is opportunistically managed between balance sheet and secondary market sales • Bar Harbor Wealth Management, along with brokerage, continues to add new customers while navigating a tumultuous market breaching $3.5 billion in AUM Q2 2026 LTM Non-interest Income Composition Historical Non-interest Income ($000s) Highlights Trust & Wealth 37% Customer Service Fees 40% Mortgage Banking 5% Customer Derivative Fees 5% Other 13% $43M Total 42,261 34,647 35,073 36,888 34,456 43,038 2021 2022 2023 2024 2025 Q2 2026 LTM 29.2% 23.3% 22.6% 24.4% 22.8% 22.3% % of operating revenue |

| $0.26 $0.28 $0.30 $0.32 $0.34 2022Q2 2023Q2 2024Q2 2025Q2 2026Q2 11.73% 10.77% 10.99% 11.22% 11.45% 2025Q2 2025Q3¹ 2025Q4 2026Q1 2026Q2 12.34% 11.33% 11.54% 11.77% 12.00% 2025Q2 2025Q3¹ 2025Q4 2026Q1 2026Q2 13.76% 13.05% 13.18% 13.43% 13.52% 2025Q2 2025Q3¹ 2025Q4 2026Q1 2026Q2 Continued Commitment to Strong Capital 15 Total Capital to Risk-Weighted Assets CET 1 Capital to Risk-Weighted Assets Cash Dividend Paid Per Share Tier 1 Capital to Risk-Weighted Assets Regulatory Well Capitalized Minimum of 10% Regulatory Well Capitalized Minimum of 8% Regulatory Well Capitalized Minimum of 6.5% 1 2025Q3 capital ratios reflect the acquisition of Guaranty Bancorp, Inc., which was completed on July 31, 2025. |

| Fostering Sustainable Communities 16 Note: Information as of December 31, 2025 |

| Confirmation of our Durability 17 |

| Investor Relations Contact Information 18 Facebook @BHBTsocial LinkedIn Bar Harbor Bank & Trust Instagram @BHBTSocial Connect with us on Social Media Visit our Website barharbor.bank/shareholder-relations Contact by Phone 207-288-2637 Write to us at Bar Harbor Bankshares Attn: Investor Relations PO Box 400 Bar Harbor, ME 04609-0400 Contact by Email investorrelations@barharbor.bank |

|

| 20 Enhancing our New Hampshire Franchise • Closed the Guaranty acquisition effective July 31, 2025; successfully completed system conversion in early October • This strategic expansion enabled Bar Harbor Bank & Trust to add nine New Hampshire branches, broadening the Bank’s footprint in an adjacent, contiguous geography. • The merger allows Bar Harbor Bank & Trust to enhance our deposit and loan base, while creating new opportunities for cross-sell and fee income. • Both institutions are long-standing community banks (Bar Harbor founded 1887; Woodsville founded 1889), which supports alignment in values and customer focus. Acquisition of Guaranty Bancorp, Inc. |

| Interest Rate Sensitivity Position 21 • The Bank’s net interest income (“NII”) sensitivity is slightly asset sensitive as the bank continues to optimize its balance sheet mix to maximize margin while limiting risk to acceptable levels. • Economic value of equity (“EVE”) is slightly liability sensitive, with Asset/Swap duration (1.9) and Liability duration (2.3) closely matched to minimize risk • Continue to enhance and expand our use of models within the organization, strengthening various asset/liability assumptions and testing methods |

| Non-GAAP to GAAP Reconciliations 22 Dollar values in millions, except per share amounts Unaudited Q2 2026 Net income (A) $15,221 Non-core items (Gain) loss on available-for-sale debt securities 25 (Gain) loss on sale of premises and equipment, net -- (Gain) loss and other expenses on other real estate owned 273 Acquisition, conversion and other expenses (36) Income tax expense¹ (65) Total non-core items 197 Core earnings (B) $15,418 Net interest income (C) 37,919 Non-interest income 11,732 Total revenue $49,651 (Gain) loss on available-for-sale debt securities 25 Total core revenue (D) $49,676 Total non-interest expense 29,182 Non-core expenses: (Gain) loss on sale of premises and equipment, net -- (Gain) loss and other expenses on other real estate owned (273) Acquisition, conversion and other expenses 36 Total non-core expenses (237) Core non-interest expense (E) $28,945 1 Assumes a tax rate of 24.65% in the second quarter of 2026 2 Tangible shareholders’ equity is computed by taking total shareholders’ equity less the intangible assets at period-end. Tangible assets is computed by taking total assets less the intangible assets at period-end 3 All performance ratios are based on average balance sheet amounts, where applicable 4 Efficiency ratio is computed by dividing core non-interest expense net of franchise taxes and intangible amortization divided by core revenue on a fully taxable equivalent basis |

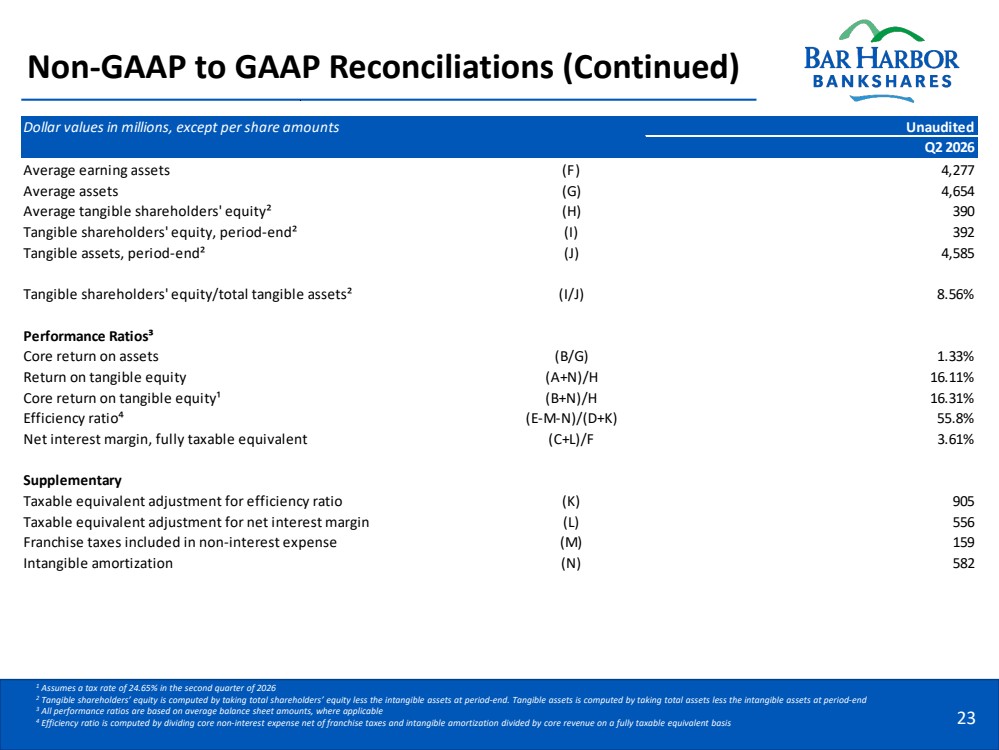
| 23 Dollar values in millions, except per share amounts Unaudited Q2 2026 Average earning assets (F) 4,277 Average assets (G) 4,654 Average tangible shareholders' equity² (H) 390 Tangible shareholders' equity, period-end² (I) 392 Tangible assets, period-end² (J) 4,585 Tangible shareholders' equity/total tangible assets² (I/J) 8.56% Performance Ratios³ Core return on assets (B/G) 1.33% Return on tangible equity (A+N)/H 16.11% Core return on tangible equity¹ (B+N)/H 16.31% Efficiency ratio⁴ (E-M-N)/(D+K) 55.8% Net interest margin, fully taxable equivalent (C+L)/F 3.61% Supplementary Taxable equivalent adjustment for efficiency ratio (K) 905 Taxable equivalent adjustment for net interest margin (L) 556 Franchise taxes included in non-interest expense (M) 159 Intangible amortization (N) 582 1 Assumes a tax rate of 24.65% in the second quarter of 2026 2 Tangible shareholders’ equity is computed by taking total shareholders’ equity less the intangible assets at period-end. Tangible assets is computed by taking total assets less the intangible assets at period-end 3 All performance ratios are based on average balance sheet amounts, where applicable 4 Efficiency ratio is computed by dividing core non-interest expense net of franchise taxes and intangible amortization divided by core revenue on a fully taxable equivalent basis Non-GAAP to GAAP Reconciliations (Continued) |