

(OTCQX: FMCB) February 2, 2026 2025 Year-End Update

Our Story Founded in 1916; Headquartered in Lodi, CA Serving Central California; 33 locations; 383 employees Expanded into San Francisco Bay Area in 2013 Expertise in Ag Lending >100 years; 19th largest in US Unique premier region; CA 4th largest economy in the world Full complement of products & services; commercial middle market focus; diversified portfolio; relationship driven History of consistent and reliable profitable growth Strategic focus on superior client service Serve our constituents – customers, shareholders, communities, employees Assets $5.7bn RBC 15.29% NIM 4.15% TCE 11.15% ROA 1.67% ROE 15.11% Note: As of December 31, 2025


Our Geographic Markets Market Area Metrics: Population of 6.6 million (1) GDP of $539 billion (2) Median household income of $97,861 (1) Diversified industries Territory stretches 100 miles north to south and 60 miles east to west Majority of the State’s watershed occurs in the Bank’s territory Source: United States Census Bureau as of 12/31/2024. Source: Federal Reserve Bank of St. Louis (FRED) as of 12/31/2023.

Annual Financial Highlights

History of Steady & Reliable Growth
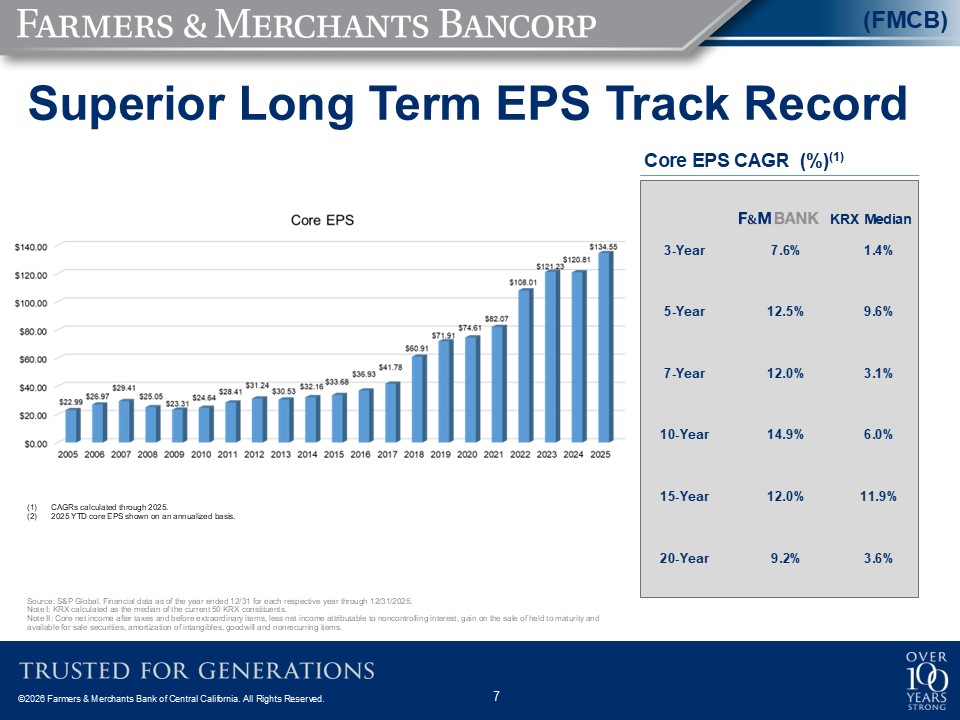
KRX Median Superior Long Term EPS Track Record Source: S&P Global. Financial data as of the year ended 12/31 for each respective year through 12/31/2025. Note I: KRX calculated as the median of the current 50 KRX constituents. Note II: Core net income after taxes and before extraordinary items, less net income attributable to noncontrolling interest, gain on the sale of held to maturity and available for sale securities, amortization of intangibles, goodwill and nonrecurring items. Core EPS CAGR (%)(1) CAGRs calculated through 2025. 2025 YTD core EPS shown on an annualized basis.

Top Tier TBV Compounded Growth Source: S&P Global. Financial data as of the year ended 12/31 for each respective year through 12/31/2025. Note: KRX calculated as the median of the current 50 KRX constituents. KRX Median TBVPS CAGR (%)(1) CAGRs calculated through 2025. Non-GAAP measurement – see appendix for reconciliation

Balance Sheet Highlights

Earnings Highlights NIM is on a tax equivalent basis

Strong Returns and Capital Position
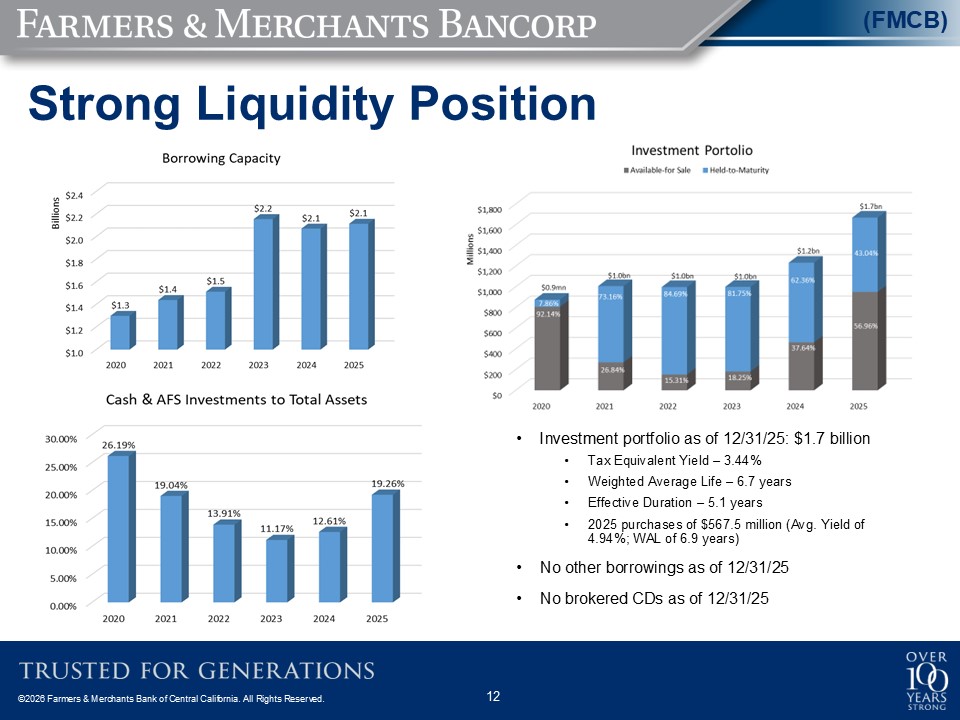
Strong Liquidity Position Investment portfolio as of 12/31/25: $1.7 billion Tax Equivalent Yield – 3.44% Weighted Average Life – 6.7 years Effective Duration – 5.1 years 2025 purchases of $567.5 million (Avg. Yield of 4.94%; WAL of 6.9 years) No other borrowings as of 12/31/25 No brokered CDs as of 12/31/25

Composition of Loans & Deposits As of December 31, 2025 Loan composition – 58% fixed; 42% variable Loan-to-deposit ratio – 73.67% Cost of average total deposits – 1.22% Cost of total interest bearing deposits – 1.79%

Our Expertise in Agriculture 19th largest Ag lender in the US Uniquely located in the premier agricultural region of the Central Valley from a climate, soil and water perspective Ag lender for over 100 years Diversified Ag portfolio Ag related lending is approximately $1.0 billion or 26.6% of the loan portfolio as of 12/31/25 Significant Ag related deposits Strong credit culture Net charge-offs of $1.3 million for Ag loans over the last 10 years from 2016 to 2025 No non-performing Ag loans of as of 12/31/25

CRE & Construction Portfolio CRE & Construction portfolio represents 43.9% of total loan portfolio as of 12/31/25 Operated below the regulatory thresholds of 100% for construction and 300% for total CRE; as of 12/31/25: Construction concentration – 20.1% Total CRE concentration – 172.5% Well-diversified; strong credit culture Net charge-offs of $380,000 for CRE and zero for construction over the last 5 years from 2021 to 2025 $750,000 of non-performing loans as of 12/31/25 As of December 31, 2025

Strong Credit Quality Net charge-offs of $4.2 million over the last 10 years (2016-2025); Adopted CECL on 1/1/22 Net charge-offs of $1.8 million, or 0.05% of average loans and leases for 2025; $682,000, or 0.02% for 2024 Non-performing loans of $750,000 or 0.02% of total loans and leases as of 12/31/25; $929,000 or 0.03% as of 12/31/24 Allowance for Credit Losses (ACL) on loans and leases of $76.4 million or 2.08% of total loans and leases as of 12/31/25 Experienced lenders, conservative and disciplined credit culture

Shareholder Returns Average annual total shareholders’ return of 14.70% over the last 29 years; through 12/31/25 Annual cash dividend growth rate of 11.11% over the last 29 years; through 12/31/25 Since 12/31/19 reduced the number of outstanding shares by 8.13% through 12/31/25 In 2025, repurchased 33,562 or 4.80% of outstanding shares; In 2024, repurchased 48,173 shares or 6.44% of outstanding shares Ranked 17th out of 57 public companies to be considered a “Dividend King” by Sure Dividend; requires 50+ years of consecutive dividends; F&M has delivered 90 years of consecutive dividends and 60 years of continuous increases Based on the dividend record date; moved from semi-annual dividend to quarterly dividend beginning in Q3-2025

Awards & Recognition F&M Bank is rated as one of the nation’s safest banksby nationally recognized bank rating firms(1) : BauerFinancial, Inc. – “5-Star, Superior Bank” & “Best of Bauer” The Findley Reports – “Super Premier Performer” VERIBANC® – “Blue Ribbon Bank Commendation of Excellence” (1) BauerFinancial rating as of 1/28/2026. The Findley Reports rating is an annual award as of 12/31/2025. The Veribanc rating is a quarterly award as of 12/31/2025. 2022 #1 – Best Performing Bank in the U.S. All Asset Classes • Rating as of July 2023 2023 #2 – Best Performing Bank in the U.S. All Asset Classes • Rating as of July 2024 2024 #3 – Best Performing Bank in the U.S. All Asset Classes • Rating as of July 2025 2022 #1 Community Bank in California Rating as of October 2021 2023 #4 Community Bank in the U.S. Assets of $3-10B • Rating as of December 2023 2025 #5 Dividend Champion Based on expected returns over the next 5 years Rating as of July 2025 “Dividend King”#17 out of 57 companies
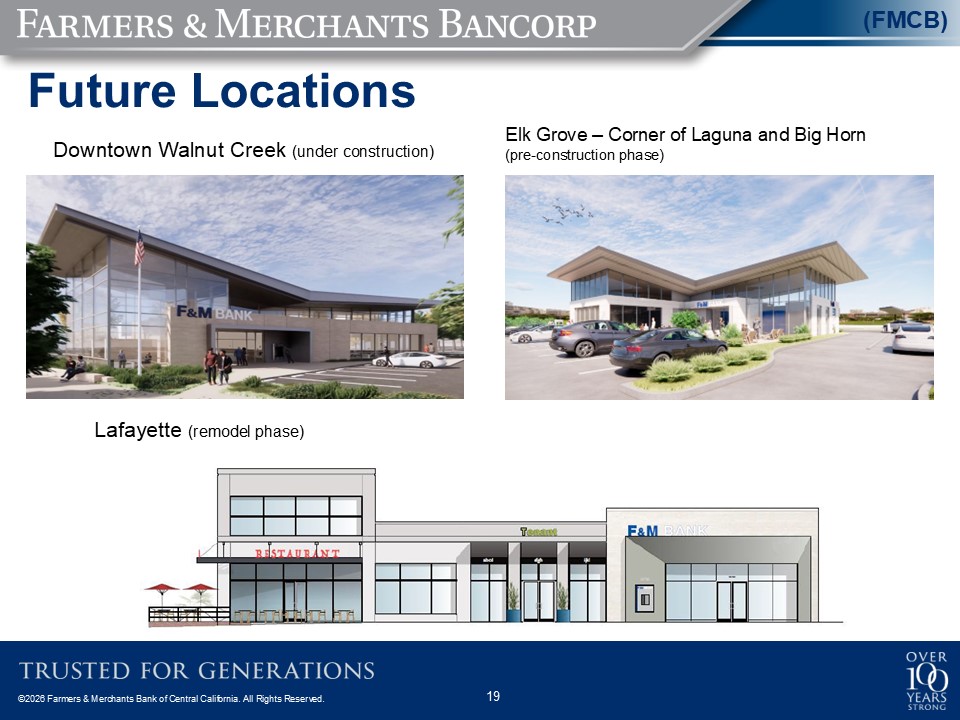
Future Locations Lafayette (remodel phase) Downtown Walnut Creek (under construction) Elk Grove – Corner of Laguna and Big Horn (pre-construction phase)

FMCB Investment Thesis Consistent earnings growth and superior shareholder returns Steady and strong growth in tangible book value per share History of 90 consecutive years of dividends with 60 years of increases Unique expertise in Ag lending results in a more diversified loan portfolio resulting in a lower CRE concentration Geographically located in a premier location of the Central Valley and Bay Area of California where the majority of the State’s watershed flows Seasoned management team with deep and diverse banking experience Highly efficient branch network with premier locations Strong and disciplined credit culture Well-positioned, diversified and strong balance sheet with conservative loan-to-deposit ratio

Appendix

Non-GAAP Measurements (1) Tangible common equity divided by tangible assets. (2) Total common equity divided by common shares outstanding. (3) Tangible common equity divided by common shares outstanding. (4) In 2025, replaced Non-Qualified Retirement Plan with a Restricted Stock Plan
Forward-Looking Statements This presentation may contain certain forward-looking statements that are based on management's current expectations regarding the Company’s financial performance. Forward-looking statements can be identified by the fact that they do not relate strictly to historical or current facts. They often include words such as “believe,” “expect,” “intend,” “estimate” or words of similar meaning, or future or conditional verbs such as “will,” “would,” “should,” “could” or “may.” Forward-looking statements in this presentation include, without limitation, statements regarding the Company’s strategic positioning and focus, growth, credit culture, competitive positioning and prospects, and new branch locations (either planned or under construction). Forward-looking statements in this presentation include matters that involve known and unknown risks, uncertainties and other factors that may cause actual results to differ materially from results expressed or implied by such forward-looking statements. Such risk factors include, among others: the effects of and changes in monetary and fiscal policies, including the interest rate policies of the Federal Open Market Committee and their effects on inflation risk; financial and regulatory policies of the United States government; tariffs; political and economic uncertainty, including any decline in global, domestic or local economic conditions or the stability of credit and financial markets; and other relevant risks detailed in the Company’s Form 10-K, Form 10-Qs, and various other securities law filings made periodically by the Company, copies of which are available from the Company’s website. All such factors are difficult to predict and are beyond the Company's ability to control or predict. There also may be additional risks that the Company does not presently know, or that the Company currently believes to be immaterial, that could also cause actual results to differ materially and adversely from those contained in these forward-looking statements. Any forward-looking statement made by us in this presentation is based only on information currently available to us and speaks only as of the date on which it is made. The Company undertakes no obligation to publicly update or revise any forward-looking statements, whether as a result of new information, future events or circumstances after the date of this presentation or otherwise, except as may be required by applicable law.
