

Pampa Energía, an independent energy company with active participation in the Argentine oil, gas and electricity, announces the results for the semester and quarter ended on June 30, 2026.
Buenos Aires, August 4, 2026 Basis of presentation Pampa reports its financial information in US$, its functional currency. For local currency equivalents, transactional FX is applied. However, Transener and TGS’s figures are adjusted for inflation as of June 30, 2026, and converted to US$ using the period-end FX rate. Prior quarter figures remain unchanged as reported. Q2 26 main results1 Sales reached US$746 million in Q2 262, up 53% year-on-year, driven by the WEM’s new deregulation framework, which supported higher spot energy prices and B2B PPA sales, in addition to higher crude oil output and increased gas sales to power generation, and stronger Reformer prices. Lower Plan Gas and petrochemical volumes offset these effects. The Q2 26 reflected the continued ramp-up at Rincón de Aranda, alongside strong power generation performance, boosted by higher seasonal spot prices and the vertical integration with gas upstream.
Note: * Price net of export duty and quality/logistic discounts. Adjusted EBITDA3 totaled US$415 million, a 75% year-on-year increase, explained by higher contribution from RDA, greater power and gas vertical integration and increased spot and B2B margins in power generation, partially offset by lower realized crude oil prices due to hedging. Net income attributable to shareholders was US$172 million, 4.3x Q2 25, driven by stronger operating margins and lower income tax, partially offset by lower gains from financial instruments. Net debt stood at US$1.3 billion as of June 2026, vs. US$801 million as of December 2025, reflecting higher capital expenditures on RDA and increased collateral requirements due to oil hedging. | ||
 |
Buenos Aires Ticker: PAMP |
|
 |
New York Stock Exchange Ticker: PAM 1 ADS = 25 common shares |
|
Share capital as of |
||

1 The information is based on FS prepared according to IFRS in force in Argentina.
2 Sales from the affiliates CTBSA, Transener and TGS are excluded, shown as ‘Results for participation in joint businesses and associates.’
3 Consolidated adjusted EBITDA represents the flows before financial items, income tax, depreciations and amortizations, extraordinary and non-cash income and expense, equity income, and includes affiliates’ EBITDA at our ownership.
Earnings Release Q2 26 ● 1

- Relevant events
| 1.1 | Urea project: entry into the fertilizer business with the construction of Latin America’s largest urea plant |
On July 17, 2026, Pampa’s Board of Directors approved the final investment decision of US$2.7 billion to build a granular urea production plant in Bahía Blanca, in southern Buenos Aires Province. This milestone marks Pampa’s entry into the fertilizer business, a critical commodity for agricultural production and global food security, and is aligned with the Company’s strategy of monetizing its Vaca Muerta shale gas reserves through high-value-added businesses while further strengthening its industrial profile.
The project will be developed by Fértil Pampa, a wholly owned subsidiary of Pampa, on an 80-hectare site within the Bahía Blanca Industrial Complex. With an annual production capacity of 2.1 million tons of granular urea, it will be the largest urea plant in Latin America by production capacity. The project includes the construction of a 3,430-ton-per-day single-train ammonia plant, a two-train granular urea plant with a combined production capacity of 6,000 tons per day, a desalination plant to supply process water, storage silos, and new logistics infrastructure at the Port of Bahía Blanca, including truck and vessel loading facilities for export and domestic markets.
The selected location provides an outstanding competitive advantage by connecting the Vaca Muerta natural gas pipeline system with one of Argentina’s main export ports and Pampa’s thermal and renewable power generation assets. Natural gas and electricity account for approximately 70% of urea production costs, and will be supplied primarily by Pampa. This vertical integration is expected to enhance operating efficiency and also support the project’s long-term profitability.
In addition to diversifying Pampa’s revenue base, the fertilizer business will also help Argentina’s generation of foreign currency through import substitution and increased exports, with an estimated annual contribution of approximately US$1 billion. Brazil, which imports 8 million tons of urea per year, in addition to the rest of the Southern Cone, with an annual deficit of 2 million tons, will be the project’s primary markets.
Completion is expected to take approximately 41 months, and SACDE will carry out the civil construction, while Tecnimont will focus on engineering and procurement. Process technology will be provided by Nextchem, through its subsidiary Stamicarbon, jointly with KBR, both recognized as global leaders in fertilizer production technologies. Tecnimont, Nextchem and Stamicarbon are part of Italy’s MAIRE Group.
At peak construction, the project is expected to create more than 3,500 direct jobs, in addition to a significant number of indirect jobs across the supply chain. Once operational, the facility is expected to employ approximately 300 people. Fértil Pampa will prioritize the hiring of local workers and suppliers from Bahía Blanca and surrounding areas, while also creating opportunities for internal mobility within the Company.
On April 21, 2026 and June 10, 2026, respectively, Fértil Pampa submitted applications for the project to qualify under the RIGI and REPIE regimes. Approval under both regimes is essential to the development of the project. As of the date of this Earnings Release, the evaluation committee has cleared Fértil Pampa’s admission to the RIGI framework, with approval publication in the Official Gazette still pending.
Marcelo Mindlin, Chairman of Pampa Energía, stated: ‘This represents the largest investment in Pampa’s history and the most significant project we have undertaken in many years. Argentina currently depends on fertilizers imported from distant regions exposed to considerable geopolitical uncertainty. This plant will provide Argentina with a reliable and competitive domestic supply of urea while creating new export opportunities across the region and international markets. It will generate valuable foreign currency revenues, expand into new markets, and transform Vaca Muerta’s natural gas into a high value-added product for one of Argentina’s most important economic sectors—its agricultural industry.’
Earnings Release Q2 26 ● 2
| 1.2 | Oil and gas |
RDA Project: Approval under RIGI
On July 21, 2026, the MECON approved the RDA Project’s application to join the RIGI under the PEELP category (Res. No. 1,025/26).
The application includes the drilling and completion of 259 wells in RDA, the construction of a treatment and processing facility with capacity to handle up to 45 kbpd of crude oil and 0.8 mcmpd of natural gas, as well as the infrastructure required to evacuate production, including oil and gas pipelines, and water treatment facilities for the final disposal of flowback water. Total estimated investment amounts to US$4.5 billion and is expected to be deployed through 2041.
The approval of the RIGI represents a significant milestone for the development of RDA, as it provides a stable framework and tax, customs, and foreign exchange incentives for 30 years. In addition, projects classified as PEELP are eligible for specific benefits, including an exemption from export duties starting in the second year following enrollment in the regime. In this sense, Pampa expects to export all of RDA’s production, which is estimated to generate US$17 billion over the project’s useful life.
FLNG: San Matías Pipeline approval under RIGI
On June 26, 2026, the MECON approved San Matías Pipeline S.A.’s application to the RIGI, a company in which Pampa holds a 20% equity interest (Res. No. 873/26).
San Matías Pipeline will be responsible for the construction and operation of the dedicated pipeline for SESA’s FLNG project, which will connect natural gas production from the Neuquén Basin to the Gulf of San Matías in Río Negro Province, where the liquefaction vessels will be supplied with gas for LNG exports. The approximately 470-km pipeline will have a 36-inch diameter and transportation capacity of up to 28 mcmpd of natural gas. The estimated investment amounts to US$1.5 billion, and full commercial operation is expected to begin in the second quarter of 2028.
| 1.3 | Generation |
Capacity awarding in the GPM expansion and final tranches
As part of the expansion of the GPM and final sections, on June 3, 2026, TGS received bids for the second stage of the tender process, covering the remaining available transportation capacity, with priority granted to natural gas distribution companies. Awarded shippers will enter into firm transportation agreements for up to 35 years, effective May 2027. It is worth highlighting that on April 15, Pampa was awarded 3.2 mcmpd of transportation capacity in the tranche supplying the Buenos Aires metro area.
For the Buenos Aires metro area tranche, 60% of the 12 mcmpd of incremental transportation capacity was offered, for which Pampa and its subsidiaries bid 11.8 mcmpd. In addition, 60% of the 2 mcmpd of incremental capacity in the Bahía Blanca section was tendered, with Pampa and its subsidiaries submitting bids totaling 9.6 mcmpd. As of today, the awards under the second tender remain pending.
In addition to securing the evacuation of increased natural gas production from Pampa’s E&P business, the awarded capacity provides significant benefits to our power generation business. Under the Res. SE No. 400/25 new framework, electricity generated using natural gas transported through new infrastructure, such as the GPM expansion and its final sections, captures the full dispatch margin when sold into the spot market (FRA=1), enhancing the competitiveness and profitability of Pampa’s generation assets, particularly our CCGTs.
End of HINISA and HIDISA’s concessions
On June 30, 2026, the SE proposed extending HIDISA’s concession through December 15, 2026, subject to Pampa’s acceptance, unless the concession was awarded earlier through a public bidding process.
Earnings Release Q2 26 ● 3
Pampa decided not to accept the proposed extension and, to ensure the service, will continue operating the assets for an additional 90 days.
HINISA’s concession expired on July 31, 2026, and the assets were subsequently reverted to Hidroelectricidad Mendocina S.A., the provincial energy company. On July 28, the National Government and the Province of Mendoza launched a national and international public tender for the concession of the Los Nihuiles Complex hydroelectric generation (Nihuiles I, II, III and IV), together with the sale of 100% equity of Hidroelectricidad Mendocina S.A. (DNU No. 667/26). In addition, the Province of Mendoza approved the bidding terms for the joint tender and submitted them to the National Government’s review (Provincial Decree No. 1,436/26). Hidroelectricidad Mendocina S.A. will continue operating the complex until December 31, 2026, unless the concession is awarded earlier.
LNG auctions
During Q2 26, MEGSA tendered take-or-pay LNG volumes offered by ENARSA. LNG helps mitigate seasonal constraints in the natural gas transportation system and secures fuel supply for power generation during periods of peak demand. In addition, its cost is passed through to the spot market energy remuneration by CAMMESA.
Between June and July 2026, Pampa was awarded 74.5 mcm of LNG, which was consumed at CTGEBA, while CTEB consumed its awarded allocation of 51.6 mcm. For August 2026, Pampa bid for 39.5 mcm of LNG for CTGEBA, and 34.4 mcm for CTEB. Both plants were awarded on July 23, 2026. The purchase prices were US$22, US$18 and US$25 per MBTU for June, July and August, respectively.
| 1.4 | Transener and TGS |
Tariff updates
| Applicable as of: |
Transener/Transba | TGS | ||
| Increase | Resolution | Increase | Resolution | |
| April 2026 | 1.6% | ENRE No. 180 and 181/26 | 2.2% | ENARGAS No. 361/26 |
| May 2026 | 2.3% | ENRE No. 225 and 226/26 | 4.2% | ENARGAS No. 448/26 |
| June 2026 | 4.3% | ENREGE No. 18 and 17/26 | 4.2% | ENREGE No. 56/26 |
| July 2026 | 2.4% | ENREGE No. 176 and 180/26 | 2.6% | ENREGE No. 161/26 |
| August 2026 | 1.4% | ENREGE No. 338 and 340/26 | 1.7% | ENREGE No. 356/26 |
TGS Private Initiative
On May 12, 2026, the MECON approved TGS’s application for the expansion of GPM’s first tranche to join the RIGI, together with its investment plan, effective as of April 30, 2026 (Res. No. 676/26).
Integrated NGL Project: Final Investment Decision
On June 10, 2026, TGS announced the final investment decision to develop the Integrated NGL Project, which entails a US$3 billion investment, the largest of its kind in Argentina’s history and a key milestone in the expansion of TGS’s midstream business.
The project, which is expected to be completed over the next four years, includes the expansion of the Tratayén treatment plant and the construction of a 100-km segregation pipeline, a multi-product pipeline to Bahía Blanca, fractionation and storage facilities, and a marine export terminal. Once commissioned, the project is expected to generate approximately 4,000 direct jobs, 15,000 indirect jobs, and around US$1.2 billion in annual exports, further strengthening Argentina’s midstream infrastructure and its capacity to monetize Vaca Muerta’s NGLs.
Earnings Release Q2 26 ● 4
- Analysis of Q2 26 results
| Breakdown by segment In US$ million |
Q2 26 | Q2 25 | Variation | ||||||
| Sales | Adjusted EBITDA | Net Income | Sales | Adjusted EBITDA | Net Income | Sales | Adjusted EBITDA | Net Income | |
| Oil and Gas | 334 | 182 | (13) | 204 | 87 | 20 | +64% | +109% | NA |
| Power generation | 351 | 155 | 130 | 185 | 112 | (5) | +90% | +39% | NA |
| Petrochemicals | 138 | 20 | 14 | 122 | 3 | (13) | +13% | NA | NA |
| Holding, transport and others | 9 | 58 | 41 | 5 | 35 | 38 | +80% | +66% | +8% |
| Eliminations | (86) | - | - | (30) | - | - | +187% | NA | NA |
| Total | 746 | 415 | 172 | 486 | 237 | 40 | +53% | +75% | NA |
Note: Net income is attributable to the Company’s shareholders.
| Reconciliation of adjusted EBITDA, in US$ million |
First half | Second quarter | ||||
| 2026 | 2025 | 2026 | 2025 | |||
| Consolidated operating income | 449 | 234 | 271 | 113 | ||
| Consolidated depreciations and amortizations | 264 | 181 | 142 | 97 | ||
| Reporting EBITDA | 713 | 415 | 413 | 210 | ||
| Adjustments from oil and gas segment | (19) | (3) | (10) | (1) | ||
| Adjustments from generation segment | (32) | 15 | (24) | 14 | ||
| Adjustments from petrochemicals segment | 4 | (17) | 1 | (0) | ||
| Adjustments from holding, transport & others segment | 75 | 47 | 35 | 14 | ||
| Consolidated adjusted EBITDA | 740 | 457 | 415 | 237 | ||
| At our ownership | 736 | 455 | 414 | 236 | ||
Earnings Release Q2 26 ● 5
| 2.1 | Analysis of the oil and gas segment |
| Oil & gas segment, consolidated Figures in US$ million |
First half | Second quarter | ||||
| 2026 | 2025 | ∆% | 2026 | 2025 | ∆% | |
| Sales revenue | 581 | 350 | +66% | 334 | 204 | +64% |
| Domestic sales | 371 | 284 | +31% | 211 | 164 | +28% |
| Foreign market sales | 210 | 66 | +218% | 123 | 40 | +208% |
| Cost of sales | (396) | (270) | +47% | (218) | (152) | +43% |
| Gross profit | 185 | 80 | +131% | 116 | 52 | +123% |
| Selling expenses | (48) | (34) | +41% | (26) | (17) | +53% |
| Administrative expenses | (42) | (40) | +5% | (21) | (19) | +11% |
| Other operating income | 15 | 16 | -6% | 13 | 12 | +8% |
| Other operating expenses | (5) | (8) | -38% | (2) | (5) | -60% |
| Recovery of impairment/(Impairment) of financial assets | 2 | (2) | NA | 3 | (2) | NA |
| Impairment of inventories | (1) | (1) | - | - | (1) | -100% |
| Results for participation in joint businesses | 7 | 2 | +250% | 4 | 2 | +100% |
| Operating income | 113 | 13 | NA | 87 | 22 | +295% |
| Finance costs | (57) | (55) | +4% | (32) | (30) | +7% |
| Other financial results | (12) | - | NA | (22) | 4 | NA |
| Financial results, net | (69) | (55) | +25% | (54) | (26) | +108% |
| Loss before tax | 44 | (42) | NA | 33 | (4) | NA |
| Income tax | 48 | 13 | +269% | (46) | 24 | NA |
| Net (loss)/income for the period | 92 | (29) | NA | (13) | 20 | NA |
| Adjusted EBITDA | 286 | 128 | +124% | 182 | 87 | +109% |
| Increases in PPE | 424 | 453 | -6% | 228 | 306 | -26% |
| Depreciation and amortization | 192 | 118 | +63% | 105 | 66 | +59% |
| Lifting cost | 130 | 103 | +26% | 75 | 58 | +29% |
| Lifting cost per boe | 7.2 | 7.8 | -9% | 7.7 | 7.6 | +1% |
Sales in the oil and gas segment rose 64% year-on-year, driven by shale oil production ramp-up at Rincón de Aranda, higher gas sales to our CCGTs under the new WEM normalization guidelines and tariff increases in the retail segment. These effects were partially offset by lower volumes sold under the Plan Gas GSA, mainly due to the pass-through of CAMMESA contracts and lower sales to industrial customers. Quarter-on-quarter, the 36% sales increase is attributable to higher seasonal gas demand from retailers and thermal power generation.
Regarding operational performance, total production reached a quarterly record high of 107.5 kboepd in Q2 26, up 28% year-on-year, driven by higher crude oil output at RDA and greater gas volumes allocated to self-supply our CCGTs under the spot market. Compared with Q1 26, production increased 7%, supported by continued growth at RDA and seasonal demand from retail and power generation, partially offset by lower gas volumes for self-supply and industrial customers amid seasonal pipeline constraints.
Gas production was 14.3 mcmpd (+10% vs. Q2 25, +4% vs. Q1 26). Regarding our operated blocks, Sierra Chata led the production with a quarterly record of 7.4 mcmpd in Q2 26 (+95% vs. Q2 25, +22% vs. Q1 26), boosted by the tie-in of 4 new shale wells in April 2026. El Mangrullo contributed 5.2 mcmpd (-30% vs. Q2 25, -14% vs. Q1 26), with no new wells tied in since July 2024. Together, Sierra Chata and El Mangrullo accounted for 88% of total gas production. Associated gas from Rincón de Aranda and Parva Negra Este exploratory well contributed 0.3 mcmpd (+40% vs. Q1 26).
In non-operated areas, Río Neuquén produced 1.1 mcmpd (-17% vs. Q2 25, -6% vs. Q1 26), a decline partially offset by 2 new tight wells tied in. Rincón del Mangrullo and Aguaragüe continued reducing to 0.2 mcmpd, explained by the natural decline with no new activity.
Earnings Release Q2 26 ● 6
| Oil and gas' key performance indicators |
2026 | 2025 | Variation | ||||||
| Oil | Gas | Total | Oil | Gas | Total | Oil | Gas | Total | |
| First half | |||||||||
| Volume | |||||||||
| Production | |||||||||
| In thousand m3/day | 3.4 | 14,037 | 0.9 | 12,375 | +282% | +13% | +33% | ||
| In million cubic feet/day | 496 | 437 | |||||||
| In thousand boe/day | 21.5 | 82.6 | 104.1 | 5.6 | 72.8 | 78.5 | |||
| Sales | |||||||||
| In thousand m3/day | 3.3 | 14,084 | 0.8 | 12,434 | +308% | +13% | +32% | ||
| In million cubic feet/day | 497 | 439 | |||||||
| In thousand boe/day | 20.8 | 82.9 | 103.7 | 5.1 | 73.2 | 78.3 | |||
| Average Price | |||||||||
| In US$/bbl | 58.5 | 63.7 | -8% | +7% | |||||
| In US$/MBTU | 3.8 | 3.5 | |||||||
| Second quarter | |||||||||
| Volume | |||||||||
| Production | |||||||||
| In thousand m3/day | 3.7 | 14,284 | 1.3 | 12,933 | +194% | +10% | +28% | ||
| In million cubic feet/day | 504 | 457 | |||||||
| In thousand boe/day | 23.4 | 84.1 | 107.5 | 8.0 | 76.1 | 84.1 | |||
| Sales | |||||||||
| In thousand m3/day | 3.4 | 14,501 | 1.0 | 12,975 | +224% | +12% | +29% | ||
| In million cubic feet/day | 512 | 458 | |||||||
| In thousand boe/day | 21.2 | 85.4 | 106.6 | 6.6 | 76.4 | 82.9 | |||
| Average Price | |||||||||
| In US$/bbl | 58.8 | 61.6 | -4% | +15% | |||||
| In US$/MBTU | 4.6 | 4.0 | |||||||
Note: Net production in Argentina. Gas volume standardized at 9,300 kCal. Oil price is net of export duty and quality/logistic discounts. First semester of 2025 includes production from El Tordillo and La Tapera-Puesto Quiroga, blocks transferred to Crown Point Energía S.A. in October 2025 (crude oil production of 1.5 kbpd during 6M25 and 1.6 kbpd in Q2 25).
The average gas price increased 15% vs. Q2 25 to US$4.6 per MBTU, due to higher pass-through of gas cost consumed in our thermal power plants, in addition to higher retail prices following consecutive tariff adjustments amid a stable FX environment. Lower export prices partially offset these effects. The realized prices increased 57% compared with Q1 26, due to seasonality.
Regarding gas deliveries by customer, during Q2 26, 26% of gas sales were allocated to CAMMESA for thermal dispatch (43% in Q2 25) and 30% to retail distributors (37% in Q2 25). Together, these segments accounted for 56% of volume sold under the Plan Gas, compared with 80% in Q2 25, reflecting the pass-through of GSAs to our power plants. As a result, intersegment consumption increased to 31% of total sales (3% in Q2 25), mainly driven by fuel self-procurement at CTLL and CTGEBA and, to a lesser extent, at CTIW, under the new WEM guidelines and the higher fuel cost pass-through by CAMMESA. Intersegment consumption also includes recurring but marginal supply to our petrochemical plants. The remaining 13% of volume sold comprised industrial/spot market (4% vs. 9% in Q2 25) and exports, which remained stable (9% vs. 8% in Q2 25).
Oil production reached 23.4 kbpd in Q2 26 (3x vs. Q2 25, +20% vs. Q1 26), driven by the continued ramp-up at RDA, which averaged 22.2 kbpd in Q2 26 (+17.0 kbpd vs. Q2 25, +22% vs. Q1 26), supported by 43 producing wells (17 in Q2 25, flat vs. Q1 26). In July, 10 wells were completed and are ready to be tied in during August. The divestment of El Tordillo and La Tapera-Puesto Quiroga in October 2025 partially offset these effects (-1.6 kbpd vs. Q2 25).
The oil price, net of export duty and commercial discounts, averaged US$58.8 per barrel (-4% vs. Q2 25, flat vs. Q1 26), impacted by the Brent hedge over RDA’s production. Without the hedge, the realized price would have been US$91.0 per barrel, resulting in approximately US$64 million of additional revenue. Exports accounted for 57% of total volume sold in Q2 26 (55% in Q2 25 and Q1 26).
Earnings Release Q2 26 ● 7
The lifting cost4 totaled US$75 million in Q2 26, +29% vs. Q2 25, explained by the second TPF at RDA, which increased treatment capacity from 20 to 28 kbpd, in addition to higher treatment costs associated with increased gas production. These effects were partially offset by lower labor costs, following the divestment of El Tordillo. Quarter-on-quarter, the 35% increase in lifting costs reflects the new TPF and higher maintenance and treatment costs resulting from greater gas volumes, partially offset by lower gas transport costs at Sierra Chata. The lifting cost per boe reached US$7.7/boe produced, flat vs. Q2 25, as the increase in total cost was offset by higher production from RDA and the gas blocks. Compared with Q1 26, lifting cost per boe increased 25% due to the new TPF, which outpaced sequential production growth at RDA.
Excluding depreciation, amortization and lifting costs, other operating costs totaled US$85 million (+33% vs. Q2 25, +8% vs. Q1 26), mainly due to higher royalties and transportation costs in line with increased production, partially offset by lower crude oil inventories.
Other operating income, net of expenses increased by US$4 million vs. Q2 25 to US$11 million, explained by improved collections and lower environmental remediation provisions, partially offset by lower income from Plan Gas compensation after royalties, as a result of higher realized US$ prices in the retail segment. Compared with Q1 26, it also increased by US$12 million, due to Plan Gas seasonality.
Financial results in Q2 26 recorded a net loss of US$54 million (+108% vs. Q2 25, +260% vs. Q1 26), driven by lower gains on Brent derivatives not designated as hedging, as well as FX losses from the higher monetary asset position in AR$.
| Reconciliation of adjusted EBITDA from oil & gas, in US$ million |
First half | Second quarter | ||||
| 2026 | 2025 | 2026 | 2025 | |||
| Consolidated operating income | 113 | 13 | 87 | 22 | ||
| Consolidated depreciations and amortizations | 192 | 118 | 105 | 66 | ||
| Reporting EBITDA | 305 | 131 | 192 | 88 | ||
| Deletion of inventories' impairment | 1 | 1 | - | 1 | ||
| Deletion of gain from commercial interests | (3) | (2) | (1) | (0) | ||
| Deletion of SESA's equity income | (7) | (2) | (4) | (2) | ||
| Reclassification of TPF lease as lifting cost | (10) | - | (5) | - | ||
| Adjusted EBITDA from oil & gas | 286 | 128 | 182 | 87 | ||
Our oil and gas adjusted EBITDA amounted to US$182 million in Q2 26, +109% vs. Q2 25, primarily driven by the shale oil production ramp-up at RDA, higher gas prices and increased gas self-supply to our thermal power plants following the gradual normalization of the WEM. These effects were partially offset by lower realized oil prices and reduced Plan Gas sales due to the pass-through of contracts, in addition to higher royalties and treatment costs in line with increased production, particularly from the commissioning of RDA’s second TPF. Compared with Q1 26, adjusted EBITDA grew 74%, mainly due to higher gas deliveries and winter prices. The adjusted EBITDA excludes extraordinary and non-cash income and expenses, overdue commercial interests, and equity income from affiliates, and includes a US$5 million reclassification to lifting costs related to the TPF lease at RDA, which is recognized as a capital expenditure under IFRS.
Capital expenditures amounted to US$228 million (-26% vs. Q2 25, but +16% vs. Q1 26), with 72% allocated to the development of RDA.
4 It only considers maintenance, treatment, internal transportation, wellhead staff and the TPF rental costs at Rincón de Aranda, which under IFRS it is recorded as Leases, accruing amortization on rights-of-use in the cost of sales. Lifting cost does not include amortizations and depreciations.
Earnings Release Q2 26 ● 8
| 2.2 | Analysis of the power generation segment |
| Power generation segment, consolidated Figures in US$ million |
First half | Second quarter | ||||
| 2026 | 2025 | ∆% | 2026 | 2025 | ∆% | |
| Sales revenue | 630 | 380 | +66% | 351 | 185 | +90% |
| Cost of sales | (408) | (205) | +99% | (238) | (102) | +133% |
| Gross profit | 222 | 175 | +27% | 113 | 83 | +36% |
| Selling expenses | (2) | (2) | - | (1) | (1) | - |
| Administrative expenses | (22) | (21) | +5% | (11) | (10) | +10% |
| Other operating income | 8 | 13 | -38% | 4 | 7 | -43% |
| Other operating expenses | (7) | (5) | +40% | (2) | (4) | -50% |
| Results for participation in joint businesses | 60 | 7 | NA | 39 | (6) | NA |
| Operating income | 259 | 167 | +55% | 142 | 69 | +106% |
| Finance income | 8 | 8 | - | 4 | 2 | +100% |
| Finance costs | (18) | (25) | -28% | (9) | (13) | -31% |
| Other financial results | 29 | 80 | -64% | 9 | 49 | -82% |
| Financial results, net | 19 | 63 | -70% | 4 | 38 | -89% |
| Profit before tax | 278 | 230 | +21% | 146 | 107 | +36% |
| Income tax | (56) | (111) | -50% | (14) | (113) | -88% |
| Net income for the period | 222 | 119 | +87% | 132 | (6) | NA |
| Attributable to owners of the Company | 218 | 119 | +83% | 130 | (5) | NA |
| Attributable to non-controlling interests | 4 | - | NA | 2 | (1) | NA |
| Adjusted EBITDA | 299 | 242 | +24% | 155 | 112 | +39% |
| Adjusted EBITDA at our share ownership | 295 | 240 | +23% | 154 | 111 | +38% |
| Increases in PPE and right-of-use assets | 4 | 28 | -86% | 2 | 20 | -89% |
| Depreciation and amortization | 72 | 60 | +20% | 37 | 29 | +28% |
In Q2 26, power generation sales grew 90% year-on-year, driven by the self-supply and pass-through of fuel costs for our power units operating under the spot market, including the LNG consumed at CTGEBA in June. This revenue is offset by the cost of gas purchased from our oil and gas segment and ENARSA’s LNG auctions, which are recorded in the power generation segment’s cost of sales. On top of the LNG cost, CAMMESA recognizes a 25% procurement margin. Additionally, sales increase reflected greater dispatch margins at CTGEBA and CTLL CCGTs, which are the most competitive units in our spot market portfolio, benefited from higher system marginal costs, particularly from May onward due to seasonal winter demand. Higher B2B PPA sales to industrial customers at CTLL also contributed to the segment’s sales increase. Expiration of Energía Plus contracts, the outage of CTLL’s GT04 under PPA through the end of May, and weaker performance of the PEPE wind farms under MATER offset these effects. Compared with Q1 26, sales increased 26% due to higher winter spot energy prices and increased B2B PPA sales in the MAT.
Within the spot segment, capacity payments for CCGTs decreased to US$4.5 thousand per MW-month (-15% vs. Q2 25, -16% vs. Q1 26). Moreover, gas and steam-fired peakers averaged US$6.2 thousand per MW-month (+18% vs. Q2 25, but -18% vs. Q1 26), supported by CPB’s ability to operate on alternative fuels. Hydros averaged US$2.3 thousand per MW-month (+3% vs. Q2 25, flat vs. Q1 26).
Regarding operational performance, operated power generation increased by 14% year-on-year, outperforming the national grid. This growth was driven by higher economic dispatch at CTLL (+452 GWh), the completion of upgrade works at CTEB during Q2 25 (+448 GWh) and, given the rising system marginal costs, increased dispatch from units operating under PPAs, primarily CTGEBA’s new CCGT (+90 GWh), CTPP (+47 GWh), and CTIW (+54 GWh). These effects were partially offset by lower power generation at CTGEBA’s old CCGT due to gas transportation capacity constraints (-285 GWh), as well as a higher CVP at CPB (-161 GWh). Compared with Q1 26, generation dropped 7%, mainly due to lower dispatch at CPB and CTGEBA.
The average availability of Pampa’s operated units reached 88.4% in Q2 26 vs. 91.6% in Q2 25 (-315 basis points), reflecting the ongoing forced outages at HINISA, outages at CTG’s ST13 in April and GT01 in June, and CTLL’s GT04 through the end of May 2026, as well as the programmed overhaul at CTEB.
Earnings Release Q2 26 ● 9
By comparison, Q2 25 was affected by scheduled maintenance in CTLL and upgrade works in CTEB. Thermal availability dropped 305 basis points to 91.2% in Q2 26. In Q1 26, total and thermal availability stood at 89.9% and 91.1%, respectively.
| Power generation's key performance indicators |
2026 | 2025 | Variation | ||||||||||
| Wind | Hydro | Thermal | Total | Wind | Hydro | Thermal | Total | Wind | Hydro | Thermal | Total | ||
| Installed capacity (MW) | 427 | 938 | 4,107 | 5,472 | 427 | 938 | 4,107 | 5,472 | +0% | - | +0% | -0% | |
| Contracted capacity (MW) | 427 | 25 | 1,483 | 1,935 | 427 | - | 1,343 | 1,769 | +0% | na | +10% | +9% | |
| Market share (%) | 1.0% | 2.1% | 9.2% | 12.2% | 1.0% | 2.1% | 9.4% | 12.5% | -0% | -0% | -0% | -0% | |
| First half | |||||||||||||
| Net generation (GWh) | 807 | 658 | 9,637 | 11,101 | 824 | 777 | 9,054 | 10,655 | -2% | -15% | +6% | +4% | |
| Volume sold (GWh) | 811 | 657 | 9,735 | 11,203 | 826 | 778 | 9,469 | 11,072 | -2% | -16% | +3% | +1% | |
| Average price (US$/MWh) | 68 | 29 | 74 | 71 | 69 | 21 | 39 | 40 | -2% | +37% | +91% | +78% | |
| Average gross margin (US$/MWh) | 55 | 15 | 31 | 31 | 54 | 10 | 24 | 25 | +2% | +54% | +28% | +25% | |
| Second quarter | |||||||||||||
| Net generation (GWh) | 368 | 342 | 4,654 | 5,363 | 406 | 293 | 4,006 | 4,704 | -9% | +17% | +16% | +14% | |
| Volume sold (GWh) | 376 | 341 | 4,646 | 5,363 | 406 | 293 | 4,210 | 4,909 | -7% | +16% | +10% | +9% | |
| Average price (US$/MWh) | 69 | 24 | 92 | 86 | 69 | 24 | 42 | 43 | -0% | -3% | +119% | +99% | |
| Average gross margin (US$/MWh) | 54 | 9 | 34 | 34 | 57 | 9 | 24 | 26 | -5% | -3% | +40% | +30% | |
Note: Gross margin before amortization and depreciation. It includes CTEB (co-operated by Pampa, 50% equity stake).
Excluding depreciation and amortization, operating costs increased to US$213 million in Q2 26 (+154% year-on-year, +45% vs. Q1 26), mainly due to higher gas purchases from our E&P to supply our thermal power plants. Compared with Q1 26, said purchases were made at higher prices due to seasonality.
Other net operating income, net of expenses posted a US$2 million profit vs. US$3 million in Q2 25, explained by lower insurance recoveries after repair costs.
Financial results in Q2 26 recorded a net gain of US$4 million (-89% vs. Q2 25, -73% vs. Q1 26), explained by lower income from financial instruments, partially offset by lower financial costs.
| Reconciliation of adjusted EBITDA from power generation, in US$ million |
First half | Second quarter | ||||
| 2026 | 2025 | 2026 | 2025 | |||
| Consolidated operating income | 259 | 167 | 142 | 69 | ||
| Consolidated depreciations and amortizations | 72 | 60 | 37 | 29 | ||
| Reporting EBITDA | 331 | 227 | 179 | 98 | ||
| Deletion of CTEB's equity income | (60) | (7) | (39) | 6 | ||
| Deletion of commercial interests to CAMMESA | (3) | (2) | (1) | (1) | ||
| Deletion of provision in hydros | - | 0 | - | - | ||
| CTEB's EBITDA, at our 50% ownership | 31 | 23 | 17 | 9 | ||
| Adjusted EBITDA from power generation | 299 | 242 | 155 | 112 | ||
Adjusted EBITDA from the power generation segment reached US$155 million in Q2 26, +39% vs. Q2 25, supported by stronger spot margins from our thermal units operating under the new WEM framework, in addition to higher capacity and energy sales under the MAT to industrial clients. These effects were partially offset by the expiration of Energía Plus contracts, CTLL’s GT04 outage and weaker load factor at the PEPEs wind farms under MATER. Compared with Q1 26, adjusted EBITDA increased 8%, mainly driven by the seasonal effect in dispatch margins, partially offset by lower generation due to gas transportation constraints. Adjusted EBITDA excludes non-operating, extraordinary and non-cash items and considers CTEB’s 50% ownership, which contributed US$17 million in Q2 26 (+88% vs. Q2 25, +16% vs. Q1 26), mainly explained by higher spot margins on its gas turbines as a result of higher system marginal cost during the winter season, as well as the margin over the LNG consumed during June.
Capital expenditures, excluding CTEB, totaled US$2 million in Q2 26, vs. US$20 million in Q2 25, mainly allocated to maintenance activities.
Earnings Release Q2 26 ● 10
| 2.3 | Analysis of the petrochemicals segment |
| Petrochemicals segment, consolidated Figures in US$ million |
First half | Second quarter | ||||
| 2026 | 2025 | ∆% | 2026 | 2025 | ∆% | |
| Sales revenue | 226 | 214 | +6% | 138 | 122 | +13% |
| Domestic sales | 123 | 131 | -6% | 70 | 74 | -5% |
| Foreign market sales | 103 | 83 | +24% | 68 | 48 | +41% |
| Cost of sales | (192) | (206) | -7% | (111) | (116) | -4% |
| Gross profit | 34 | 8 | NA | 27 | 6 | NA |
| Selling expenses | (6) | (6) | - | (3) | (3) | - |
| Administrative expenses | (3) | (3) | - | (1) | (1) | - |
| Other operating income | 1 | 19 | -95% | 1 | - | NA |
| Other operating expenses | (10) | (5) | +100% | (5) | (1) | NA |
| Operating income | 16 | 13 | +23% | 19 | 1 | NA |
| Finance income | - | 27 | -100% | - | - | NA |
| Other financial results | (7) | 3 | NA | 2 | 4 | -50% |
| Financial results, net | (7) | 30 | NA | 2 | 4 | -50% |
| Profit before tax | 9 | 43 | -79% | 21 | 5 | NA |
| Income tax | (3) | (14) | -79% | (7) | (18) | -61% |
| Net income for the period | 6 | 29 | -79% | 14 | (13) | NA |
| Adjusted EBITDA | 20 | (1) | NA | 20 | 3 | NA |
| Increases in PPE | - | 6 | -100% | - | 3 | -100% |
| Depreciation and amortization | - | 3 | -100% | - | 2 | -100% |
| Reconciliation of adjusted EBITDA from petrochemicals, in US$ million |
First half | Second quarter | ||||
| 2026 | 2025 | 2026 | 2025 | |||
| Consolidated operating income | 16 | 13 | 19 | 1 | ||
| Consolidated depreciations and amortizations | - | 3 | - | 2 | ||
| Reporting EBITDA | 16 | 16 | 19 | 3 | ||
| Deletion of project-related expenses | 4 | - | 1 | - | ||
| Deletion of gain from commercial interests | (0) | (0) | (0) | (0) | ||
| Deletion of contingencies adjustment | - | (17) | - | - | ||
| Adjusted EBITDA from petrochemicals | 20 | (1) | 20 | 3 | ||
The adjusted EBITDA for the petrochemicals segment was US$20 million in Q2 26, broadly outpacing the US$3 million recorded in Q2 25 and breakeven in the last quarter, reflected by higher international prices, which supported stronger margins on styrene and the Reformer. The decline in sales volumes partially offset said effects.
Total volume sold reached 95 thousand tons vs. 125 thousand tons in Q2 25, -24% year-on-year, due to lower Reformer volumes, in line with reduced naphtha processing, partially offset by higher SBR exports. The 14% quarter-on-quarter increase is attributable to the 35-day programmed overhaul at the Reformer during Q1 26.
Financial results recorded a net profit of US$2 million, -50% vs. Q2 25, due to higher losses from gasoline price hedging. The US$11 million improvement quarter-on-quarter is mainly explained by lower international gasoline prices and, consequently, reduced hedging losses.
Earnings Release Q2 26 ● 11
| Petrochemicals' key performance indicators |
Products | Total | ||
| Styrene & polystyrene1 | SBR | Reforming & others | ||
| First half | ||||
| Volume sold 2026 (thousand ton) | 41 | 23 | 114 | 178 |
| Volume sold 2025 (thousand ton) | 42 | 20 | 147 | 209 |
| Variation 2026 vs. 2025 | -2% | +17% | -22% | -15% |
| Average price 2026 (US$/ton) | 1,718 | 1,749 | 1,012 | 1,270 |
| Average price 2025 (US$/ton) | 1,523 | 1,742 | 787 | 1,025 |
| Variation 2026 vs. 2025 | +13% | +0% | +29% | +24% |
| Second quarter | ||||
| Volume sold Q2 26 (thousand ton) | 19 | 12 | 64 | 95 |
| Volume sold Q2 25 (thousand ton) | 22 | 9 | 93 | 125 |
| Variation Q2 26 vs. Q2 25 | -17% | +33% | -31% | -24% |
| Average price Q2 26 (US$/ton) | 2,050 | 2,030 | 1,184 | 1,459 |
| Average price Q2 25 (US$/ton) | 1,510 | 1,715 | 781 | 978 |
| Variation Q2 26 vs. Q2 25 | +36% | +18% | +52% | +49% |
Note: 1 Includes Propylene.
| 2.4 | Analysis of the holding, transport and others segment |
| Holding, transport and others segment, consolidated Figures in US$ million |
First half | Second quarter | ||||
| 2026 | 2025 | ∆% | 2026 | 2025 | ∆% | |
| Sales revenue | 17 | 12 | +42% | 9 | 5 | +80% |
| Gross profit | 17 | 12 | +42% | 9 | 5 | +80% |
| Selling expenses | - | (1) | -100% | - | (1) | -100% |
| Administrative expenses | (25) | (20) | +25% | (15) | (11) | +36% |
| Other operating income | 4 | 5 | -20% | 1 | 2 | -50% |
| Other operating expenses | (15) | (22) | -32% | (9) | (8) | +13% |
| Impairment on intangible assets | (1) | - | NA | (1) | - | NA |
| Results for participation in joint businesses | 81 | 67 | +21% | 38 | 34 | +12% |
| Operating income | 61 | 41 | +49% | 23 | 21 | +10% |
| Finance costs | (13) | (19) | -32% | (8) | (15) | -47% |
| Other financial results | 12 | 39 | -69% | 26 | 28 | -7% |
| Financial results, net | (1) | 20 | NA | 18 | 13 | +38% |
| Profit before tax | 60 | 61 | -2% | 41 | 34 | +21% |
| Income tax | 10 | 13 | -23% | - | 4 | -100% |
| Net income for the period | 70 | 74 | -5% | 41 | 38 | +8% |
| Adjusted EBITDA | 136 | 88 | +54% | 58 | 35 | +66% |
| Increases in PPE | 1 | 5 | -77% | 1 | 2 | -68% |
| Depreciation and amortization | - | - | NA | - | - | NA |
Excluding equity income from affiliates, the holding, transport and others segment recorded an operating margin loss of US$15 million in Q2 26, -15% vs. Q2 25, mainly due to higher income from fees. Compared with Q1 26, the operating loss increased 200%, explained by higher expenses related to the development of the fertilizer project.
Financial results recorded a net profit of US$18 million in Q2 26 (+38% vs. Q2 25, +195% vs. Q1 26), due to lower interest expenses on tax liabilities, partially offset by higher long-term recoverable tax credits.
Earnings Release Q2 26 ● 12
| Reconciliation of adjusted EBITDA from holding, transport and others, in US$ million | First half | Second quarter | ||||
| 2026 | 2025 | 2026 | 2025 | |||
| Consolidated operating income | 61 | 41 | 23 | 21 | ||
| Consolidated depreciations and amortizations | - | - | - | - | ||
| Reporting EBITDA | 61 | 41 | 23 | 21 | ||
| Deletion of equity income | (81) | (67) | (38) | (34) | ||
| Deletion of gain from commercial interests | (0) | - | (0) | - | ||
| Deletion of intang. assets' impairment | 1 | - | 1 | - | ||
| Deletion of arbitration costs in OCP | - | 8 | - | - | ||
| TGS's EBITDA adjusted by ownership | 110 | 79 | 50 | 34 | ||
| Transener's EBITDA adjusted by ownership | 45 | 27 | 22 | 14 | ||
| Adjusted EBITDA from holding and others | 136 | 88 | 58 | 35 | ||
The adjusted EBITDA for the segment, which excludes non-operating, non-recurring, and non-cash items and includes EBITDA adjusted for equity ownership in TGS and Transener, reached US$58 million profit in Q2 26 (+66% vs. Q2 25, but -25% vs. Q1 26).
At TGS, the EBITDA adjusted for our stake was US$50 million in Q2 26, +49% vs. Q2 25, mainly explained by higher NGL volumes and realized prices, following the recovery from the extraordinary climate event that affected Cerri in March 2025, partially offset by increased natural gas costs due to higher processed volumes. The regulated segment also outperformed in US$ terms, supported by an 11% tariff increase in Q2 26, which exceeded both inflation and AR$ devaluation, at 7% each. Compared with Q1 26, adjusted EBITDA dropped 15%, mainly explained by the AR$ devaluation and higher seasonal cost of gas.
At Transener, the EBITDA adjusted for our stake reached US$22 million (+54% vs. Q2 25, -3% vs. Q1 26), driven by an 8% quarter tariff increase, which outpaced inflation and AR$ devaluation, at 7% each.
Earnings Release Q2 26 ● 13
- Cash and financial borrowings
| As of June 30, 2026, in US$ million |
Cash1 | Financial debt | Net debt | |||
| Consolidated in FS |
Ownership adjusted | Consolidated in FS |
Ownership adjusted | Consolidated in FS |
Ownership adjusted | |
| Power generation | 1,063 | 1,050 | 437 | 437 | (626) | (613) |
| Petrochemicals | - | - | - | - | - | - |
| Holding and others | - | - | - | - | - | - |
| Oil and gas | 218 | 218 | 2,163 | 2,163 | 1,945 | 1,945 |
| Total under IFRS/Restricted Group | 1,281 | 1,268 | 2,600 | 2,600 | 1,319 | 1,332 |
| Affiliates at O/S2 | 471 | 471 | 394 | 394 | (77) | (77) |
| Total with affiliates | 1,752 | 1,739 | 2,994 | 2,994 | 1,242 | 1,255 |
Note: Financial debt includes accrued interest. 1 Includes cash and cash equivalents and financial assets at fair value. 2 Under IFRS, the affiliates CTBSA, Transener and TGS are excluded from Pampa’s consolidated figures.
| 3.1 | Debt transactions |
As of June 30, 2026, Pampa’s financial debt under IFRS totaled US$2,6 billion, 37% higher than year-end 2025. Net debt increased from US$801 million as of December 2025 to US$1,319 million, reflecting higher disbursements for the development of RDA and increased collateral requirements linked to crude oil price hedging, in addition to higher working capital in line with increased sales, partially offset by improved collection days. Compared with the March 2026 closing, the net debt rose 10%, explained by higher capex at RDA and seasonal working capital, partially offset by the release of guarantees following the decline in Brent prices.
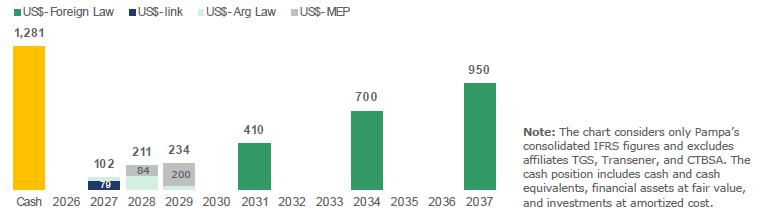
On May 21, 2026, Pampa reopened its international bond maturing November 2037, with an annual interest rate of 7.750%. The new US$500 million issuance was priced at a 7.6% yield, increasing the total outstanding amount of the 2037 Notes to US$950 million. The offering was more than two times oversubscribed, pricing at the lowest spread over U.S. Treasuries in Pampa’s debt issuance history, further extending Pampa’s maturity profile and strengthening its debt structure.
Additionally, during Q2 26, Pampa issued US$200 million of CB Series 27 US$-MEP, maturing in April 2029, with a fixed annual interest rate of 5.49%, payable semiannually. The Company also incurred US$26 million of net bank debt.
As of June 30, 2026, 97% of Pampa’s gross debt was issued in the capital markets, with the remaining 3% of bank loans. The average cost of financing was 7.3%. Details are shown below:
| Type of debt | Currency | Law | % over total gross debt |
Average rate |
Average life |
| Loans | US$ | Argentine | 3% | 5.7% | 1.9 |
| CB | US$ MEP | Argentine | 11% | 5.6% | 2.6 |
| US$ | Argentine | 4% | 7.3% | 2.1 | |
| US$-link | Argentine | 3% | - | 1.5 | |
| US$ | Foreign | 79% | 7.8% | 9.2 | |
| Total | 100% | 7.3% | 7.7 |
Note: Figures in US$ correspond to debt principal and exclude accrued interest.
Earnings Release Q2 26 ● 14
The average debt maturity was 7.7 years. The chart below shows the principal maturity profile, net of repurchases, in US$ million as of the end of Q2 26:
Regarding our affiliates, during Q2 26, CTEB repaid the outstanding US$26 million CB Series 9 at maturity and incurred US$38 million of net bank debt. Following quarter-end, CTEB agreed to extend a US$15 million bank loan maturing on November 7, 2026, at the current annual interest rate of 3.5%.
TGS borrowed US$14 million of net bank debt during Q2 25 and extended a US$48 million bank loan for an additional 180 days at an annual interest rate of 5.65%.
As of today, Pampa remains in full compliance with all debt covenants.
| 3.2 | Summary of debt securities |
| Company In US$ million |
Security | Maturity | Amount outstanding | Coupon |
| In US$ - Foreign Law | ||||
| Pampa | CB Series 21 | 2031 | 410 | 7.95% |
| CB Series 23 | 2034 | 700 | 7.875% | |
| CB Series 26 | 2037 | 950 | 7.750% | |
| TGS1 | CB Series 3 | 2031 | 490 | 8.5% |
| CB Series 4 | 2035 | 500 | 7.75% | |
| In US$ | ||||
| Pampa | CB Series 25 | 2028 | 105 | 7.25% |
| In US$-link | ||||
| Pampa | CB Series 13 | 2027 | 79 | 0% |
| In US$-MEP | ||||
| Pampa | CB Series 22 | 2028 | 84 | 5.75% |
| CB Series 27 | 2029 | 200 | 5.49% |
Note: 1 Under IFRS, affiliates are not consolidated in Pampa’s FS.
Earnings Release Q2 26 ● 15
| 3.3 | Credit ratings |
In May 2026, Fitch Ratings upgraded Pampa’s long-term foreign and local currency issuer ratings from ‘B’ to ‘B+’. Later, in June 2026, S&P upgraded the credit rating from ‘B-’ to ‘B stable’, and in August 2026, FIX SCR raised CTEB’s rating from ‘AA+’ to ‘AAA’.
| Company | Agency | Rating | |
| Global | Local | ||
| Pampa | S&P | B stable, bb- (stand-alone) | na |
| FitchRatings | B+ | AAA (long-term), A1+ (short-term)1 | |
| TGS | S&P | B, b+ (stand-alone) | na |
| Moody's | B1 | na | |
| FitchRatings | B- | na | |
| Transener | FitchRatings | na | AA (long-term)1 |
| CTEB | FitchRatings | na | AAA1 |
Note: 1 Issued by FIX SCR.
Earnings Release Q2 26 ● 16
- Appendix
| 4.1 | Analysis of the first half, by subsidiary and segment |
| Subsidiary In US$ million |
First half 2026 | First half 2025 | ||||||
| % Pampa | Adjusted EBITDA | Net debt |
Net income2 |
% Pampa | Adjusted EBITDA | Net debt |
Net income2 | |
| Oil & gas segment | ||||||||
| Pampa Energía | 100.0% | 286 | 1,945 | 92 | 100.0% | 128 | 1,186 | (29) |
| Subtotal oil & gas | 286 | 1,945 | 92 | 128 | 1,186 | (29) | ||
| Power generation segment | ||||||||
| Diamante | 61.0% | 3 | (0) | 4 | 61.0% | 4 | (0) | 2 |
| Los Nihuiles | 52.0% | 5 | (0) | 5 | 52.0% | (0) | (0) | (2) |
| VAR | 100.0% | 11 | (0) | 10 | 100.0% | 8 | - | 3 |
| CTBSA | 61 | 98 | 152 | 46 | 173 | 14 | ||
| Non-controlling stake adjustment | (31) | (49) | (76) | (23) | (86) | (7) | ||
| Subtotal CTBSA adjusted by ownership | 50.0% | 31 | 49 | 76 | 50.0% | 23 | 86 | 7 |
| Pampa stand-alone, other companies, & adj.1 | 100.0% | 249 | (626) | 122 | 100% | 207 | (474) | 109 |
| Subtotal power generation | 299 | (577) | 218 | 242 | (388) | 119 | ||
| Petrochemicals segment | ||||||||
| Pampa Energía | 100.0% | 20 | - | 6 | 100.0% | (1) | - | 29 |
| Subtotal petrochemicals | 20 | - | 6 | (1) | - | 29 | ||
| Holding, transport & others segment | ||||||||
| Transener | 169 | (135) | 95 | 102 | (127) | 61 | ||
| Non-controlling stake adjustment | (125) | 99 | (70) | (75) | 93 | (45) | ||
| Subtotal Transener adjusted by ownership | 26.3% | 45 | (35) | 25 | 26.3% | 27 | (33) | 16 |
| TGS | 409 | (336) | 205 | 305 | (2) | 128 | ||
| Non-controlling stake adjustment | (299) | 245 | (151) | (225) | 1 | (95) | ||
| Subtotal TGS adjusted by ownership | 26.9% | 110 | (90) | 54 | 26.9% | 79 | (1) | 33 |
| Pampa stand-alone, other companies, & adj.1 | 100.0% | (19) | - | (9) | 100% | (18) | - | 25 |
| Subtotal holding & others | 136 | (126) | 70 | 88 | (34) | 74 | ||
| Deletions | 100% | - | 77 | - | 100% | - | (52) | - |
| Total consolidated | 740 | 1,319 | 386 | 457 | 712 | 193 | ||
| At our share ownership | 736 | 1,255 | 386 | 455 | 773 | 193 | ||
Note: 1 The deletion corresponds to other companies or inter-company. 2 Attributable to the Company’s shareholders.
Earnings Release Q2 26 ● 17
| 4.2 | Analysis of the quarter, by subsidiary and segment |
| Subsidiary In US$ million |
Q2 26 | Q2 25 | ||||||
| % Pampa | Adjusted EBITDA | Net debt |
Net income2 |
% Pampa | Adjusted EBITDA | Net debt |
Net income2 | |
| Oil & gas segment | ||||||||
| Pampa Energía | 100.0% | 182 | 1,945 | (13) | 100.0% | 87 | 1,186 | 20 |
| Subtotal oil & gas | 182 | 1,945 | (13) | 87 | 1,186 | 20 | ||
| Power generation segment | ||||||||
| Diamante | 61.0% | 1 | (0) | 1 | 61.0% | 1 | (0) | (1) |
| Los Nihuiles | 52.0% | 2 | (0) | 2 | 52.0% | 0 | (0) | (2) |
| VAR | 100.0% | 4 | (0) | 2 | 100.0% | 4 | - | 1 |
| CTBSA | 33 | 98 | 128 | 18 | 173 | (11) | ||
| Non-controlling stake adjustment | (17) | (49) | (64) | (9) | (86) | 5 | ||
| Subtotal CTBSA adjusted by ownership | 50.0% | 17 | 49 | 64 | 50.0% | 9 | 86 | (5) |
| Pampa stand-alone, other companies, & adj.1 | 100.0% | 132 | (626) | 60 | 100% | 98 | (474) | 3 |
| Subtotal power generation | 155 | (577) | 130 | 112 | (388) | (5) | ||
| Petrochemicals segment | ||||||||
| Pampa Energía | 100.0% | 20 | - | 14 | 100.0% | 3 | - | (13) |
| Subtotal petrochemicals | 20 | - | 14 | 3 | - | (13) | ||
| Holding, transport & others segment | ||||||||
| Transener | 83 | (135) | 48 | 54 | (127) | 32 | ||
| Non-controlling stake adjustment | (61) | 99 | (36) | (40) | 93 | (24) | ||
| Subtotal Transener adjusted by ownership | 26.3% | 22 | (35) | 13 | 26.3% | 14 | (33) | 9 |
| TGS | 187 | (336) | 90 | 126 | (2) | 28 | ||
| Non-controlling stake adjustment | (137) | 245 | (65) | (92) | 1 | (21) | ||
| Subtotal TGS adjusted by ownership | 26.9% | 50 | (90) | 24 | 26.9% | 34 | (1) | 8 |
| Pampa stand-alone, other companies, & adj.1 | 100.0% | (14) | - | 4 | 100% | (13) | - | 22 |
| Subtotal holding & others | 58 | (126) | 41 | 35 | (34) | 38 | ||
| Deletions | 100% | - | 77 | - | 100% | - | (52) | - |
| Total consolidated | 415 | 1,319 | 172 | 237 | 712 | 40 | ||
| At our share ownership | 414 | 1,255 | 172 | 236 | 773 | 40 | ||
Note: 1 The deletion corresponds to other companies or inter-companies. 2 Attributable to the Company’s shareholders.
Earnings Release Q2 26 ● 18
| 4.3 | Consolidated balance sheet |
| In US$ million | As of 06.30.2026 | As of 12.31.2025 |
| ASSETS | ||
| Property, plant and equipment | 3,479 | 3,303 |
| Intangible assets | 87 | 89 |
| Right-of-use assets | 24 | 36 |
| Deferred tax asset | 182 | 43 |
| Investments in associates and joint ventures | 1,354 | 1,059 |
| Financial assets at fair value through profit and loss | 33 | 33 |
| Trade and other receivables | 78 | 43 |
| Total non-current assets | 5,237 | 4,606 |
| Inventories | 283 | 231 |
| Financial assets at fair value through profit and loss | 302 | 366 |
| Derivatives | - | 52 |
| Trade and other receivables | 948 | 614 |
| Cash and cash equivalents | 979 | 725 |
| Total current assets | 2,512 | 1,988 |
| Total assets | 7,749 | 6,594 |
| EQUITY | ||
| Share capital | 35 | 36 |
| Share capital adjustment | 189 | 191 |
| Share premium | 517 | 516 |
| Treasury shares adjustment | 1 | 1 |
| Treasury shares cost | (6) | (54) |
| Legal reserve | 44 | 44 |
| Voluntary reserve | 2,707 | 2,399 |
| Other reserves | (13) | (12) |
| Other comprehensive income | 97 | 124 |
| Retained earnings | 456 | 351 |
| Equity attributable to owners of the company | 4,027 | 3,596 |
| Non-controlling interest | 13 | 9 |
| Total equity | 4,040 | 3,605 |
| LIABILITIES | ||
| Provisions | 73 | 100 |
| Income tax and minimum notional income tax provision | 28 | 26 |
| Tax liabilities | 202 | 212 |
| Deferred tax liability | 46 | 56 |
| Defined benefit plans | 29 | 26 |
| Borrowings | 2,575 | 1,844 |
| Trade and other payables | 66 | 86 |
| Total non-current liabilities | 3,019 | 2,350 |
| Provisions | 13 | 13 |
| Income tax liability | 124 | 83 |
| Tax liabilities | 83 | 56 |
| Defined benefit plans | 6 | 6 |
| Salaries and social security payable | 26 | 36 |
| Derivatives | 54 | - |
| Borrowings | 25 | 48 |
| Trade and other payables | 359 | 397 |
| Total current liabilities | 690 | 639 |
| Total liabilities | 3,709 | 2,989 |
| Total liabilities and equity | 7,749 | 6,594 |
Earnings Release Q2 26 ● 19
| 4.4 | Consolidated income statement |
| In US$ million | First half | Second quarter | ||||
| 2026 | 2025 | 2026 | 2025 | |||
| Sales revenue | 1,319 | 900 | 746 | 486 | ||
| Domestic sales | 1,006 | 750 | 555 | 398 | ||
| Foreign market sales | 313 | 150 | 191 | 88 | ||
| Cost of sales | (862) | (625) | (482) | (340) | ||
| Gross profit | 457 | 275 | 264 | 146 | ||
| Selling expenses | (56) | (43) | (30) | (22) | ||
| Administrative expenses | (91) | (84) | (47) | (41) | ||
| Other operating income | 28 | 53 | 19 | 21 | ||
| Other operating expenses | (37) | (40) | (18) | (18) | ||
| Recovery of impairment/(Impairment) of financial assets | 2 | (2) | 3 | (2) | ||
| Impairment of intangible assets and inventories | (2) | (1) | (1) | (1) | ||
| Results for part. in joint businesses & associates | 148 | 76 | 81 | 30 | ||
| Operating income | 449 | 234 | 271 | 113 | ||
| Financial income | 7 | 35 | 3 | 2 | ||
| Financial costs | (87) | (99) | (48) | (58) | ||
| Other financial results | 22 | 122 | 15 | 85 | ||
| Financial results, net | (58) | 58 | (30) | 29 | ||
| Profit before tax | 391 | 292 | 241 | 142 | ||
| Income tax | (1) | (99) | (67) | (103) | ||
| Net income for the period | 390 | 193 | 174 | 39 | ||
| Attributable to the owners of the Company | 386 | 193 | 172 | 40 | ||
| Attributable to the non-controlling interest | 4 | - | 2 | (1) | ||
| Net income per share to shareholders | 0.3 | 0.1 | 0.1 | 0.0 | ||
| Net income per ADR to shareholders | 7.1 | 3.5 | 3.2 | 0.7 | ||
| Average outstanding common shares1 | 1,351 | 1,360 | 1,340 | 1,360 | ||
| Outstanding shares by the end of period1 | 1,340 | 1,360 | 1,340 | 1,360 | ||
Note: 1 Includes shares allocated to the employee compensation plan as treasury shares, which amounted to 3.9 million and 3.5 million shares as of June 30, 2025, and 2026, respectively. Treasury shares are deducted from shares outstanding only if they are held as common shares.
Earnings Release Q2 26 ● 20
| 4.5 | Consolidated cash flow statement |
| In US$ million | First half | Second quarter | ||||
| 2026 | 2025 | 2026 | 2025 | |||
| OPERATING ACTIVITIES | ||||||
| Profit of the period | 390 | 193 | 174 | 39 | ||
| Adjustments to reconcile net profit to cash flows from operating activities | 195 | 163 | 161 | 160 | ||
| Changes in operating assets and liabilities | (604) | (209) | (121) | (142) | ||
| Increase (decrease) in trade receivables and other receivables | (444) | (254) | 28 | (142) | ||
| Increase (decrease) in inventories | (53) | (20) | (45) | 3 | ||
| Increase (decrease) in trade and other payables | 17 | 65 | (7) | (14) | ||
| (Decrease) increase in salaries and social security payables | (10) | (10) | 4 | 3 | ||
| Defined benefit plans payments | (2) | (1) | (1) | - | ||
| Increase in tax liabilities | 38 | 13 | 45 | 8 | ||
| Decrease in provisions | (3) | (4) | (2) | (2) | ||
| Income tax payment | (50) | - | (50) | - | ||
| (Payments) Collection for derivative financial instruments, net | (97) | 2 | (93) | 2 | ||
| Net cash (used in) generated by operating activities | (19) | 147 | 214 | 57 | ||
| INVESTING ACTIVITIES | ||||||
| Payment for property, plant and equipment acquisitions | (518) | (444) | (253) | (282) | ||
| Collection for sales of public securities and shares, net | 205 | 316 | 118 | 165 | ||
| Subscription of mutual funds, net | (9) | (4) | - | (4) | ||
| Capital integration in companies | (30) | (41) | (14) | (10) | ||
| Right-of-use | - | - | - | 1 | ||
| Collection for intangible assets sales | - | 3 | - | 3 | ||
| Dividends collection | 1 | - | 1 | - | ||
| Collection for interests in areas sales | 5 | 2 | 5 | 2 | ||
| Net cash used in investing activities | (346) | (168) | (143) | (125) | ||
| FINANCING ACTIVITIES | ||||||
| Proceeds from borrowings | 732 | 380 | 732 | 335 | ||
| Payment of borrowings | (32) | (108) | (9) | (38) | ||
| Payment of borrowings interests | (68) | (101) | (46) | (63) | ||
| Repurchase and redemption of corporate bonds | (2) | (725) | - | (365) | ||
| Payment of leases | (11) | (2) | (5) | (1) | ||
| Net cash generated by (used in) financing activities | 619 | (556) | 672 | (132) | ||
| Increase (decrease) in cash and cash equivalents | 254 | (577) | 743 | (200) | ||
| Cash and cash equivalents at the beginning of the period | 725 | 738 | 236 | 361 | ||
| Increase (Decrease) in cash and cash equivalents | 254 | (577) | 743 | (200) | ||
| Cash and cash equivalents at the end of the period | 979 | 161 | 979 | 161 | ||
Earnings Release Q2 26 ● 21
| 4.6 | Power generation’s main operational KPIs by plant |
| Power generation's key performance indicators |
Wind | Hydroelectric | Subtotal hydro +wind |
Thermal | Total | ||||||||||||||||
| PEPE2 | PEPE3 | PEPE4 | PEA | PEPE6 | HINISA1 | HIDISA1 | HPPL | CTLL | CTG | CTP | CPB | CTPP | CTIW | CTGEBA | Eco- Energía |
CTEB2 | Subtotal thermal |
||||
| Installed capacity (MW) | 53 | 53 | 81 | 100 | 140 | 265 | 388 | 285 | 1,365 | 780 | 361 | 30 | 620 | 100 | 100 | 1,254 | 14 | 848 | 4,107 | 5,472 | |
| Contracted capacity (MW) | 53 | 53 | 81 | 100 | 140 | 25 | - | - | 452 | 607 | - | - | - | 100 | 100 | 397 | - | 279 | 1,483 | 1,935 | |
| Market share | 0.1% | 0.1% | 0.2% | 0.2% | 0.3% | 0.6% | 0.9% | 0.6% | 3.0% | 1.7% | 0.8% | 0.1% | 1.4% | 0.2% | 0.2% | 2.8% | 0.03% | 1.9% | 9.2% | 12% | |
| First half | |||||||||||||||||||||
| Net generation 2026 (GWh) | 94 | 110 | 160 | 174 | 268 | 101 | 224 | 333 | 1,465 | 2,347 | 95 | 33 | 424 | 120 | 164 | 4,238 | 32 | 2,184 | 9,637 | 11,101 | |
| Market share | 0.1% | 0.1% | 0.1% | 0.1% | 0.2% | 0.1% | 0.2% | 0.2% | 1.0% | 1.7% | 0.1% | 0.0% | 0.3% | 0.1% | 0.1% | 3.0% | 0.0% | 1.5% | 6.8% | 7.8% | |
| Sales 2026 (GWh) | 99 | 110 | 160 | 174 | 268 | 100 | 224 | 333 | 1,468 | 2,406 | 103 | 35 | 415 | 120 | 164 | 4,263 | 36 | 2,193 | 9,735 | 11,203 | |
| Net generation 2025 (GWh) | 97 | 115 | 177 | 155 | 280 | 164 | 272 | 341 | 1,601 | 1,960 | 189 | 25 | 398 | 88 | 81 | 4,476 | 20 | 1,818 | 9,054 | 10,655 | |
| Variation 2026 vs. 2025 | -3% | -4% | -9% | +12% | -4% | -38% | -18% | -3% | -9% | +20% | -50% | +34% | +7% | +36% | +103% | -5% | +57% | +20% | +6% | +4% | |
| Sales 2025 (GWh) | 100 | 115 | 177 | 155 | 280 | 164 | 272 | 341 | 1,603 | 1,960 | 306 | 25 | 398 | 88 | 81 | 4,733 | 55 | 1,824 | 9,469 | 11,072 | |
| Avg. price 2026 (US$/MWh) | 72 | 63 | 63 | 81 | 63 | 60 | 33 | 17 | 50 | 58 | na | 99 | 115 | na | 101 | 72 | 54 | 77 | 74 | 71 | |
| Avg. price 2025 (US$/MWh) | 92 | 63 | 63 | 79 | 63 | 16 | 28 | 18 | 46 | 27 | 67 | 56 | 58 | na | na | 36 | 40 | 36 | 39 | 40 | |
| Avg. gross margin 2026 (US$/MWh) | 47 | 55 | 55 | 63 | 53 | 35 | 20 | 6 | 37 | 27 | 72 | 24 | 43 | 124 | 67 | 27 | 18 | 29 | 31 | 31 | |
| Avg. gross margin 2025 (US$/MWh) | 49 | 55 | 55 | 52 | 56 | (0) | 18 | 8 | 32 | 18 | 32 | 26 | 32 | na | 128 | 20 | 11 | 26 | 24 | 25 | |
| Second quarter | |||||||||||||||||||||
| Net generation Q2 26 (GWh) | 45 | 52 | 76 | 67 | 127 | 27 | 84 | 230 | 710 | 1,264 | 41 | 11 | 52 | 82 | 94 | 1,985 | 15 | 1,110 | 4,654 | 5,363 | |
| Market share | 0.1% | 0.1% | 0.2% | 0.2% | 0.4% | 0.1% | 0.2% | 0.7% | 2.0% | 3.6% | 0.1% | 0.0% | 0.1% | 0.2% | 0.3% | 5.7% | 0.0% | 3.2% | 13.4% | 15.4% | |
| Sales Q2 26 (GWh) | 54 | 52 | 76 | 67 | 127 | 26 | 84 | 230 | 717 | 1,255 | 48 | 13 | 43 | 82 | 94 | 1,985 | 15 | 1,111 | 4,646 | 5,363 | |
| Net generation Q2 25 (GWh) | 46 | 59 | 91 | 65 | 144 | 42 | 71 | 180 | 699 | 812 | 48 | 11 | 213 | 34 | 40 | 2,180 | 7 | 662 | 4,006 | 4,704 | |
| Variation Q2 26 vs. Q2 25 | -1% | -13% | -16% | +3% | -12% | -36% | +19% | +28% | +2% | +56% | -13% | +3% | -76% | +138% | +137% | -9% | +107% | +68% | +16% | +14% | |
| Sales Q2 25 (GWh) | 47 | 59 | 91 | 65 | 144 | 42 | 71 | 180 | 699 | 812 | 103 | 11 | 213 | 34 | 40 | 2,312 | 23 | 662 | 4,210 | 4,909 | |
| Avg. price Q2 26 (US$/MWh) | 81 | 63 | 63 | 82 | 63 | 68 | 39 | 13 | 47 | 67 | na | 110 | na | 115 | 99 | 94 | 69 | 100 | 92 | 86 | |
| Avg. price Q2 25 (US$/MWh) | 95 | 62 | 62 | 81 | 62 | 24 | 45 | 17 | 50 | 32 | 86 | 55 | 45 | na | na | 37 | 49 | 44 | 42 | 43 | |
| Avg. gross margin Q2 26 (US$/MWh) | 52 | 56 | 56 | 58 | 52 | 17 | 20 | 4 | 33 | 32 | 62 | 20 | 131 | 93 | 61 | 30 | 27 | 30 | 34 | 34 | |
| Avg. gross margin Q2 25 (US$/MWh) | 53 | 57 | 57 | 61 | 56 | (4) | 25 | 6 | 37 | 18 | 29 | 22 | 21 | na | 127 | 21 | 7 | 28 | 24 | 26 | |
Note: Gross margin before amortization and depreciation. 1 HINISA’s concession expired on July 31, 2026. HIDISA’s concession expired on June 30, 2026, and Pampa will continue operating the plant for an additional 90 days. For further details, see the Relevant Events section. 2 Co-operated by Pampa (50% equity stake).
Earnings Release Q2 26 ● 22
| 4.7 | Production in the main oil and gas blocks |
| In kboe/day at ownership | First half | Second quarter | ||||
| 2026 | 2025 | Variation | 2026 | 2025 | Variation | |
| Gas | ||||||
| El Mangrullo | 33.2 | 41.1 | -19% | 30.8 | 44.1 | -30% |
| Sierra Chata | 39.5 | 21.6 | +83% | 43.3 | 22.2 | +95% |
| Río Neuquén | 6.7 | 8.2 | -17% | 6.6 | 7.9 | -17% |
| Rincón del Mangrullo1 | 0.8 | 1.0 | -20% | 0.8 | 1.0 | -25% |
| Others | 2.3 | 1.0 | +143% | 2.6 | 0.9 | +177% |
| Total gas at working interest | 82.6 | 72.8 | +13% | 84.1 | 76.1 | +10% |
| Oil | ||||||
| Rincón de Aranda | 20.2 | 3.1 | na | 22.2 | 5.3 | na |
| El Tordillo2 | - | 1.5 | -100% | - | 1.6 | -100% |
| Associated oil3 | 1.2 | 1.0 | +13% | 1.1 | 1.1 | +4% |
| Los Blancos | 0.1 | 0.1 | -27% | 0.1 | 0.1 | -18% |
| Total oil at working interest | 21.5 | 5.6 | +282% | 23.4 | 8.0 | +194% |
| Total | 104.1 | 78.5 | +33% | 107.5 | 84.1 | +28% |
Note: Production in Argentina. 1 It does not include shale formation. 2 Pampa transferred the 35.67% stake in the concession to Crown Point Energía in October 2025, including the La Tapera–Puesto Quiroga block. 3 From gas blocks.
Earnings Release Q2 26 ● 23
- Glossary
2037 Notes: Corporate Bonds maturing in 2037 ADR/ADS: American Depositary Receipt AR$: Argentine pesos B2B: Business-to-business boe: Barrels of oil equivalent MBTU: million British Thermal Units CAMMESA: Wholesale Electricity Market Clearing Company (Compañía Administradora del Mercado Mayorista Eléctrico S.A.) CB: Corporate bond CCGT: Combined cycle CPB: Piedra Buena Thermal Power Plant CTBSA: CT Barragán S.A. CTEB: Ensenada Barragán Thermal Power Plant CTG: Güemes Thermal Power Plant CTGEBA: Genelba Thermal Power Plant CTIW: Ingeniero White Thermal Power Plant CTLL: Loma De La Lata Thermal Power Plant CTP: Piquirenda Thermal Power Plant CTPP: Parque Pilar Thermal Power Plant CVP: Variable production cost DNU: Executive Order E&P: Exploration and Production EBITDA: Earnings before interest, tax,
depreciation and amortization EcoEnergía: EcoEnergía Cogeneration ENRE: National Electricity Regulatory Entity (Ente Nacional Regulador de la Electricidad) ENREGE: National Gas and Electricity Regulatory Entity (Ente Nacional Regulador del Gas y la Electricidad) Fértil Pampa: Fértil Pampa S.A.U. FLNG: Floating Liquefaction of Natural Gas FS: Financial Statements FX: Nominal exchange rate GPM: ‘Perito’ Moreno Gas Pipeline GSA: Gas sale agreement GWh: Gigawatt-hour HIDISA: Diamante Hydro Power Plant HINISA: Los Nihuiles Hydro Power Plant HPPL: Pichi Picun Leufu Hydro Power Plant IFRS: International Financial Reporting Standards kb/kboe:
Thousands of barrels/ |
kbpd/kboepd: Thousands of barrels per day/ MW/MWh: Megawatt/Megawatt-hour n.a.: Not applicable NGL: Natural gas liquids Pampa/The Company: Pampa Energía S.A. PEA: Arauco II Wind Farm, stages 1 and 2 PEELP: Long-Term Strategic Export Project under RIGI PEPE: Pampa Energía Wind Farm Plan Gas: Argentine Natural Gas Production
Promotion Plan (DNU No. 892/20, 730/22 and supplementary provisions) PPA: Power purchase agreement PPE: Property, plant and equipment Q1
26: First quarter of 2026 Q2 26/Q2 25: Second quarter of 2026/ TGS: Transportadora de Gas del Sur S.A. Ton: Metric ton TPF: Temporary processing facility Transba: Empresa de Transporte de Energía Eléctrica por Distribución Troncal de la Provincia de Buenos Aires Transba S.A. Transener: Compañía de Transporte de Energía Eléctrica en Alta Tensión Transener S.A. US$: U.S. Dollar US$-link: A security linked to wholesale US$ FX US$-MEP: A security settled with onshore US$ WEM: Wholesale electricity market |
Earnings Release Q2 26 ● 24